

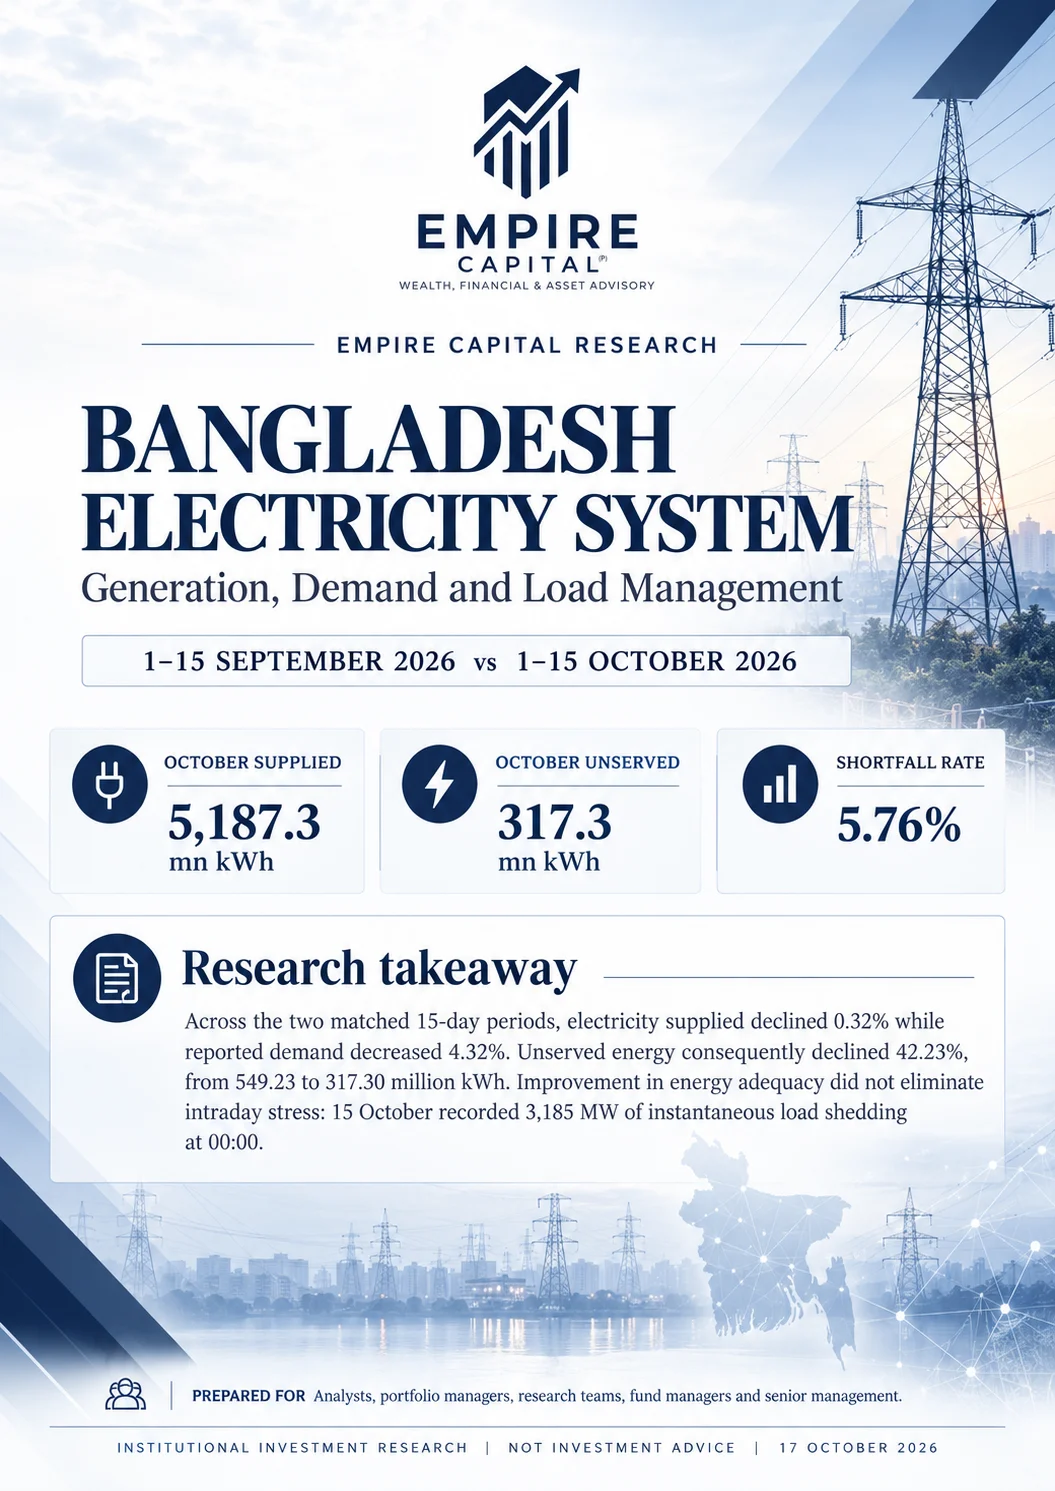
During 1–15 October 2026, electricity supplied declined slightly by 0.32% to 5,187.3 million kWh, while reported demand fell 4.32%. Unserved electricity dropped 42.23% to 317.3 million kWh, improving reported demand adequacy from 90.45% to 94.24%. However, operational stress remained visible, including a 3,185 MW instantaneous load-shedding peak on 15 October.
1 | Executive Summary & Fifteen-Day Energy Balance
The 1–15 October operating window was fully verified using the newly provided NLDC workbook dated 16 October 2026. September 1–15 represents the exact matching calendar dates. Total October energy supplied was 5,187.333 million kWh compared with 5,203.759 million kWh in September. Reported demand decreased to 5,504.617 million kWh from 5,752.991 million kWh. Reported unserved energy declined by 231.928 million kWh.
INDICATOR | SEP 1–15 | OCT 1–15 | CHANGE |
|---|---|---|---|
Electricity supplied (million kWh) | 5,203.759 | 5,187.333 | -0.32% |
Electricity demand (million kWh) | 5,752.991 | 5,504.617 | -4.32% |
Unserved electricity (million kWh) | 549.232 | 317.304 | -42.23% |
Energy unserved / demand | 9.55% | 5.76% | -3.78 pp |
Average daily supply (million kWh) | 346.92 | 345.82 | -0.32% |
Mean P1 daily load-shed snapshot (MW) | 1,643.9 | 1,154.3 | -29.79% |
15-day cumulative demand and supply
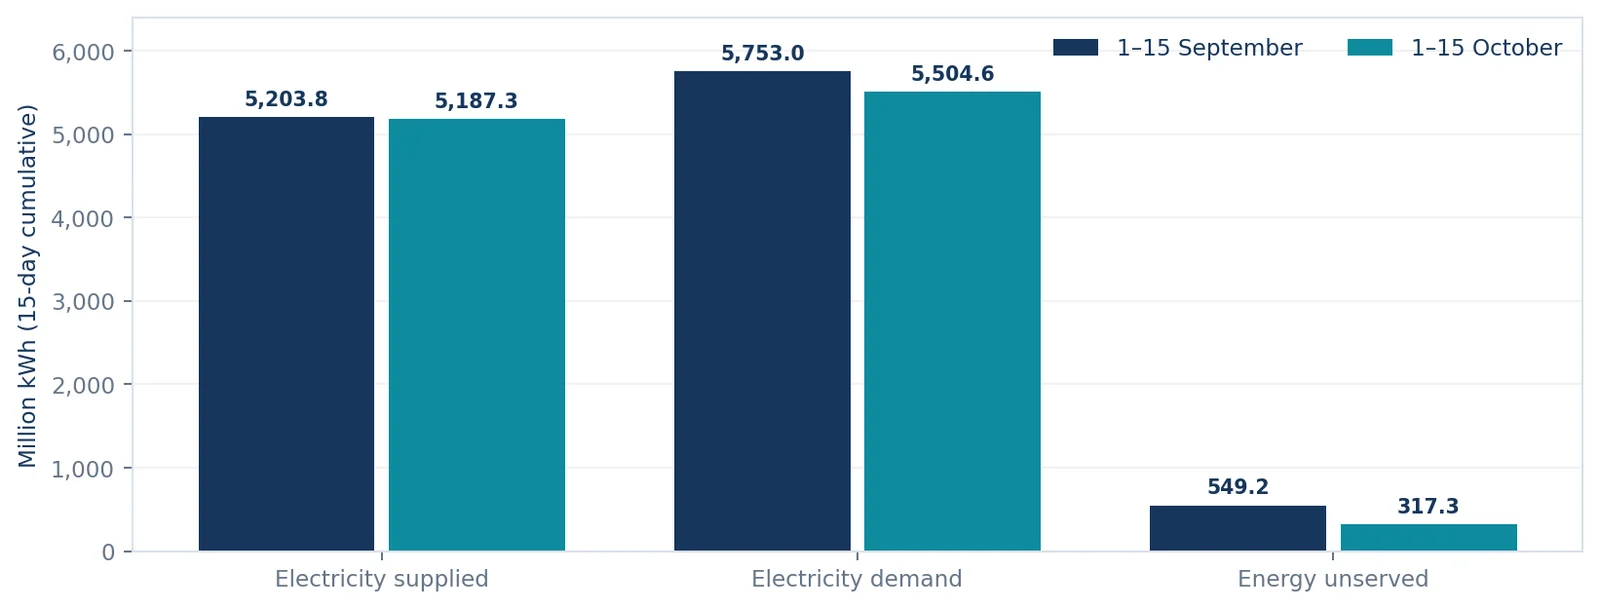
Figure 1. Cumulative national energy in…
Continue reading the full analysis
The remaining research is delivered only after server-side access verification and is not included in this page response.