

How much electricity does a 60 MW wind power plant actually deliver? Empire Capital Research examines 30 days of operating data from Cox’s Bazar’s 60 MW wind facility, covering 15 September to 14 October 2026. According to National Load Dispatch Centre (NLDC) records, the plant generated 3,987.84 MWh against a theoretical maximum of 43,200 MWh, resulting in an observed capacity factor of 9.23%. Daily performance varied significantly, while just four September days accounted for 66.51% of the period’s total generation. Our research highlights the distinction between installed renewable energy capacity and electricity actually delivered, offering important insights for investors, energy planners, policymakers, and industry stakeholders. The findings are observational and do not establish the causes of lower output.
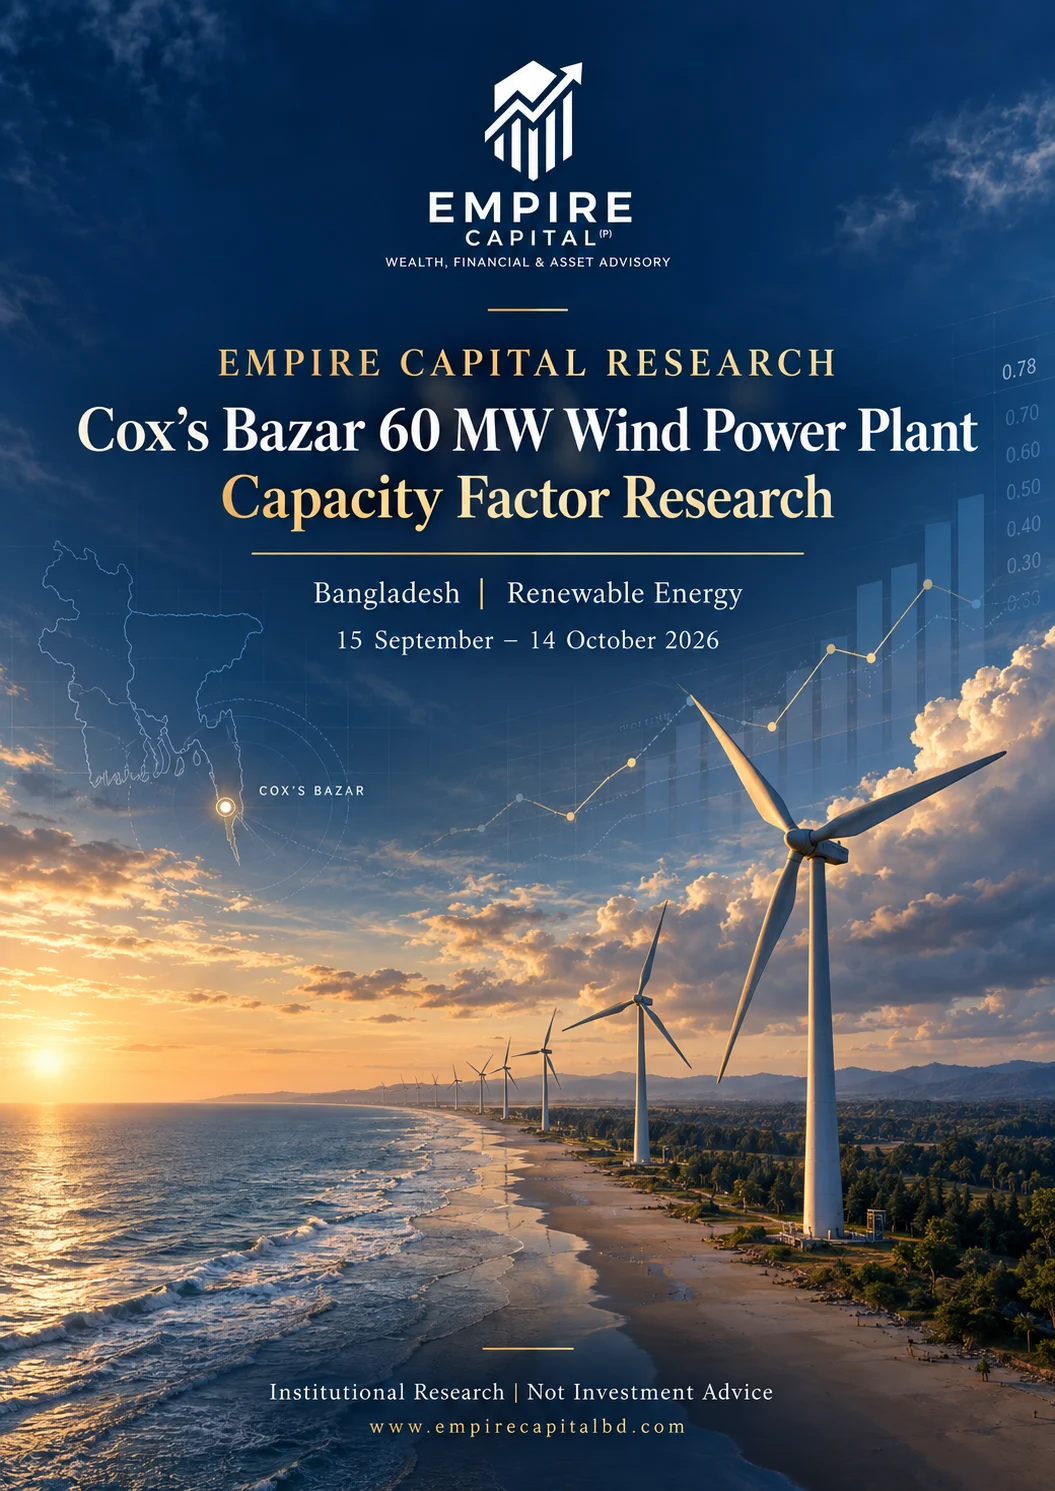

EMPIRE CAPITAL / INSTITUTIONAL RESEARCH
COX’S BAZAR
60 MW WIND POWER PLANT
Actual Generation vs Rated Capacity
Daily and Period Energy Capacity Factors
RESEARCH WINDOW / 15 SEPTEMBER – 14 OCTOBER 2026
30 OPERATING DAYS • 60 MW REPORTED CAPACITY
For Investment Analysts, Portfolio Managers, Research Teams
and Senior Management
Published 16 October 2026 | NLDC plant-level operating records
Institutional Investment Research | Not Investment Advice
CAPACITY IS NOT GENERATION
1 Executive Summary
The National Load Dispatch Centre (NLDC) daily records indicate that Cox’s Bazar Wind, reported at 60 MW, delivered a small fraction of its maximum theoretical electricity output over 15 September–14 October 2026. The plant’s 60 MW rating equates to 1,440 MWh of potential energy per day at uninterrupted full output. Metered daily energy was lower on every one of the 30 observed dates.
For the 30-day period, total recorded generation was 3,987.84 MWh versus 43,200 MWh at constant nameplate operation: a capacity factor of 9.23%. The gap of 39,212.16 MWh is the mathematical difference from that rated-output ceiling, not independently proven lost or recoverable energy.
Output was highly variable: daily capacity factors ranged from 0.03% on 9 October to 48.40% on 25 September. No observed day reached 50%. The four dates 22–25 September generated 2,652.48 MWh, equivalent to 66.51% of the 30-day total.
Table 1. Principal verified operating indicators
Measure | Value | Research interpretation |
|---|---|---|
Rated plant capacity | 60 MW | Source-reported denominator |
Maximum possible daily energy | 1,440.00 MWh | 60 MW × 24 hours |
30-day theoretical generation | 43,200.00 MWh | 60 MW × 24 h × 30 days |
30-day actual generation | 3,987.84 MWh | NLDC P2 daily energy |
30-day capacity factor | 9.23% | Actual MWh / theoretical MWh |
Maximum daily capacity factor | 48.40% | 25 Sep | 696.96 MWh generated |
Minimum daily capacity factor | 0.03% | 9 Oct | 0.48 MWh generated |
Days reaching ≥50% factor | 0 /… |
Continue reading the full analysis
The remaining research is delivered only after server-side access verification and is not included in this page response.