
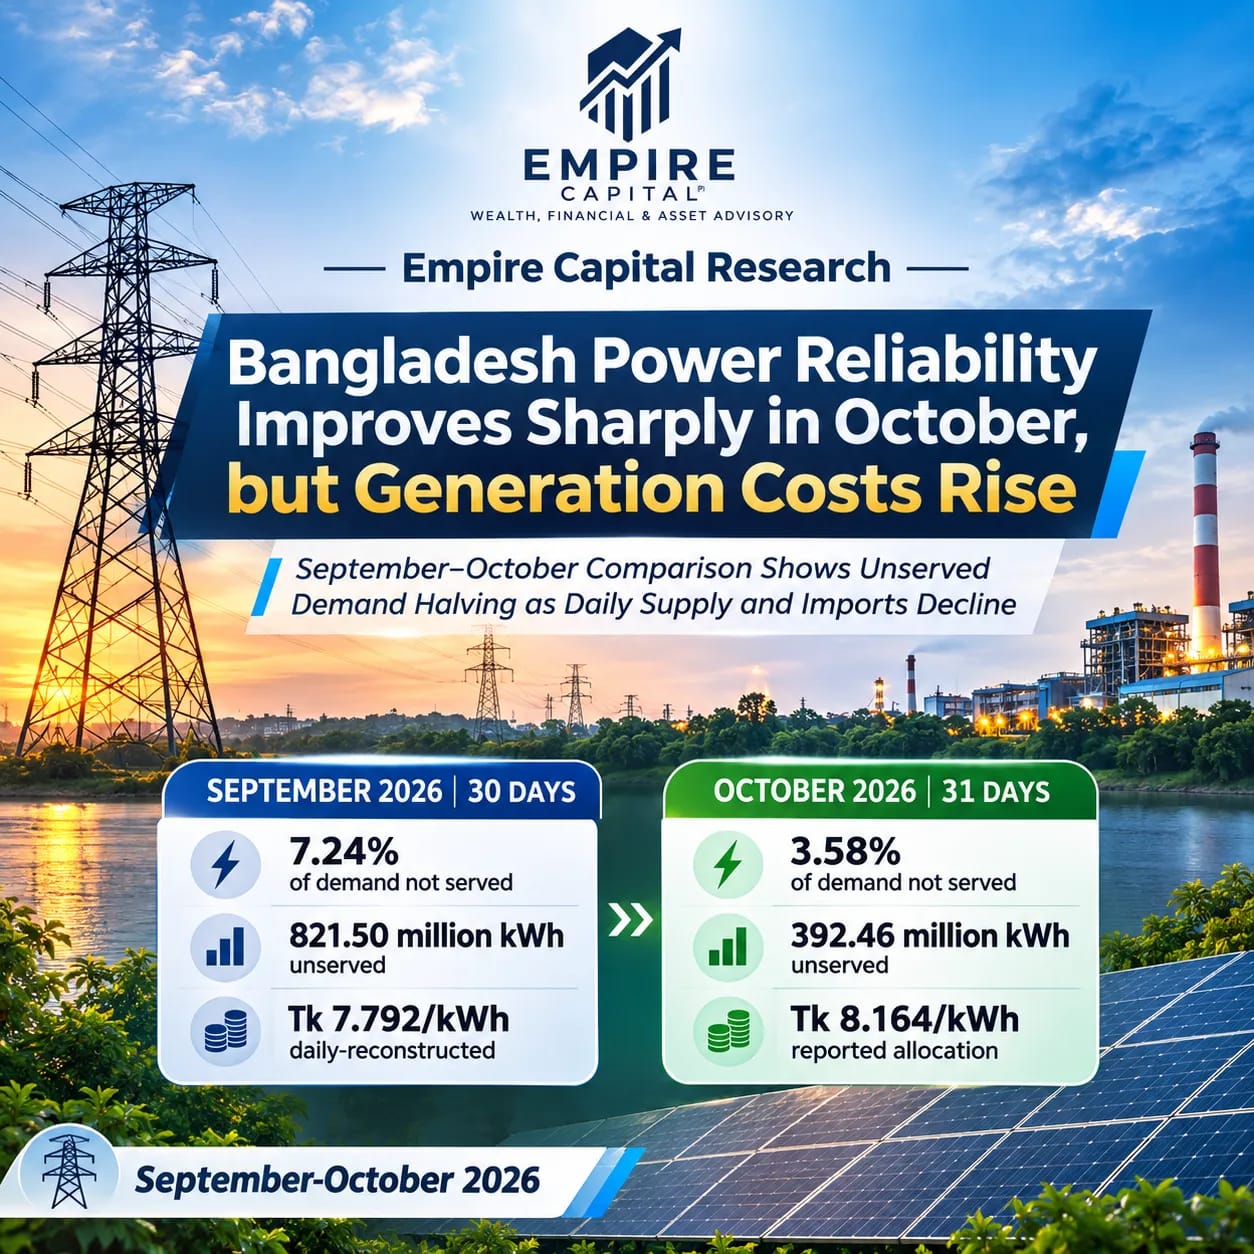
Bangladesh’s reported power-system adequacy improved materially in October 2026. Unserved electricity fell 52.23% to 392.46 million kWh, cutting the demand shortfall from 7.24% in September to 3.58%. However, average daily supply declined 2.79%, while the source-reported weighted generation cost increased 4.77% to Tk 8.164/kWh, highlighting a clear trade-off between improved adequacy and higher generation costs.
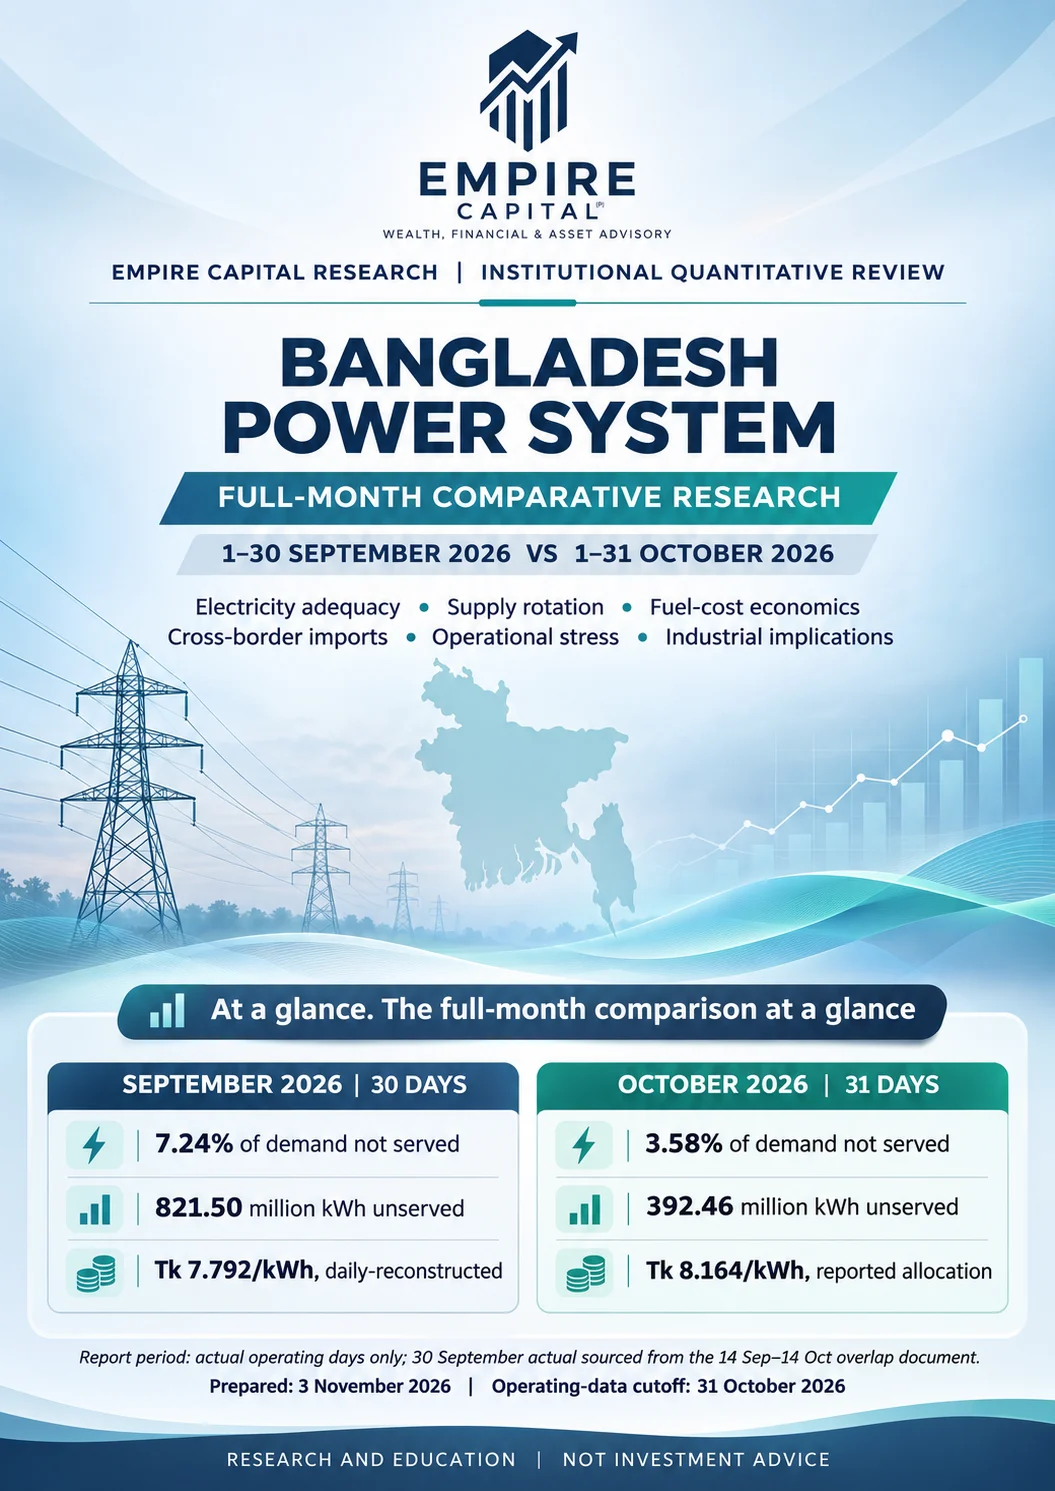
EXECUTIVE SUMMARY
Bangladesh’s reported power-system adequacy improved materially from September to October 2026. Using 30 actual operating days in September and 31 in October, electricity not served declined from 821.499 million kWh to 392.46 million kWh (-52.23%). The demand-weighted shortage rate fell from 7.24% to 3.58%—a 3.66 percentage-point improvement. October therefore met 96.42% of recorded electricity demand, compared with 92.76% in September.
The improvement should not be confused with a larger daily supply. Total electricity supplied rose only +0.45% to 10,565.00 million kWh, reflecting October’s extra calendar day. On a comparable per-day basis, supply actually fell from 350.60 to 340.81 million kWh/day (-2.79%), while reported demand declined more sharply from 377.99 to 353.47 million kWh/day (-6.49%). The observed narrowing of the demand–supply gap is an accounting result; these reports do not identify what caused the change in demand.
Fuel economics did not improve in parallel. The September source-reported energy-weighted unit cost, reconstructed from 30 daily readings, was approximately Tk 7.792/kWh, compared with October’s reported Tk 8.164/kWh (+4.77%). Heavy fuel oil rose from 14.27% of supplied energy to 16.27%. In October, HFO provided 16.27% of electricity but absorbed 41.02% of source-allocated generation cost. Imported power’s contribution decreased from 13.68% of supply in September to 11.98% in October.
The daily profile also changed. September recorded a maximum one-day shortfall of 63.722 million kWh on 10 September; October peaked at 39.178 million kWh on 15 October. September had 5 days with a shortfall above 10% of demand, versus 1 in October. Improvement was not uniform: 27 October still recorded 28.582 million kWh unserved. The outcome is a more favourable monthly balance but not proof of outage-free service.
The investment implication is conditional: lower measured energy gaps may improve industrial scheduling, but the documents do not provide a matched October factory-output or DSE market dataset proving an earnings or index response. The central policy and operating priority is to test whether the lower October shortfall persists under stronger demand while reported production-cost allocations and oil exposure moderate. The evidence supports close monitoring, not a single-factor market forecast.
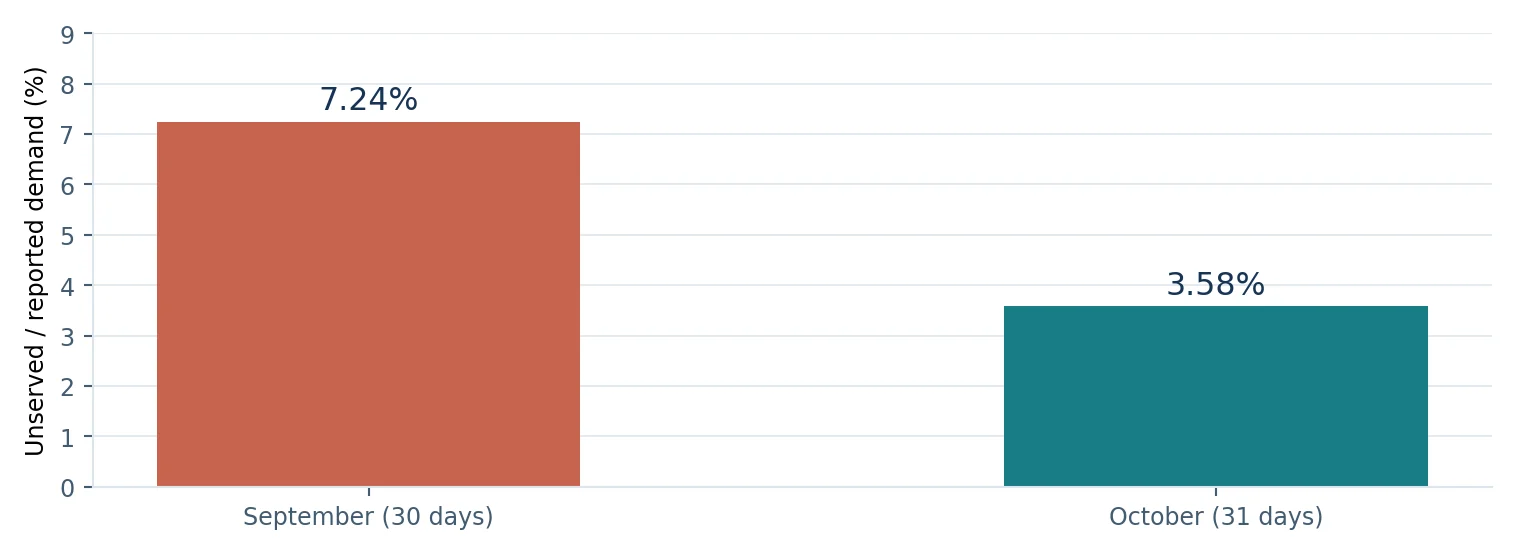
Figure 1. The full-month demand-weighted shortfall rate fell by 3.66 percentage points.
HOW TO READ THIS REPORT
Part I contains the complete September 2026 operating month (1–30 September): monthly results, every actual date, weekly performance, generation mix, imports, operating constraints, and September-only industrial and market evidence. Part II contains the complete October 2026 operating month (1–31 October): monthly results, every actual date, daily source generation, daily source costs, imports, and October operating observations. Part III compares the two complete months on identical definitions and normalized daily averages. Part IV documents the reconciliation and sources.
PART I | SEPTEMBER 2026 — COMPLETE 30-DAY MONTH
1. September full-month operating snapshot
Verified period: 1–30 September 2026, 30 actual operating days. All aggregate metrics below are based on the September calendar month alone; the 30 September observation is the actual NLDC day reported in the overlapping September–October study, not a forecast.
Table 1. September 2026: complete calendar-month headline measures
Indicator | September 2026 | Unit |
|---|---|---|
Days observed | 30 | days |
Energy supplied | 10,518.074 | million kWh |
Reported energy demand | 11,339.573 | million kWh |
Energy not served | 821.499 | million kWh |
Demand not served | 7.24 | % |
Reported demand met | 92.76 | % |
Supply / calendar day | 350.60 | million kWh/day |
Demand / calendar day | 377.99 | million kWh/day |
Unserved / calendar day | 27.38 | million kWh/day |
Imports | 1,438.80 | million kWh |
Imports per day | 47.96 | million kWh/day |
Source-reported weighted cost | 7.792 | Tk/kWh |
Reported/derived cost allocation | 81.959 | Tk billion |
Source: [S1] 1–29 September plus [S2] actual 30 September. Figures are not from the 30 September forecast.
2. September daily national system records — 1 through 30 September
September daily ledger: all 30 actual dates
The…
Continue reading the full analysis
The remaining research is delivered only after server-side access verification and is not included in this page response.