

DSEX declined 0.24% to 5,386.54 on 27 October, marking a third consecutive loss. The index briefly touched 5,378.87, marginally below the September correction low of 5,379.00, before recovering above it at the close. Breadth improved to 108 advances versus 222 declines, while regular-board turnover increased, but weakening RSI and a narrowing MACD histogram kept technical pressure elevated.

1. Executive Market Summary
The DSEX fell for a third straight session on Tuesday, 27 October 2026, losing 12.99 points (-0.24%) to 5,386.54. All four DSE indices declined: DS30 -0.14%, DSES -0.63% and CDSET -0.15%. The index traded between 5,421.51 and 5,378.87. The intraday low went 0.13 points below the 14 Sep correction low (5,379.00), the downside reference set in the 26 Oct report, but the close held 7.54 points above it.
Headline turnover slipped 1.72% to Tk 4,035.08 mn, but only because block value fell from Tk 294.20 mn to Tk 98.59 mn. Regular-board value rose 2.86% to Tk 3,909.68 mn, transactions rose 5.24% to 140,547 and volume 2.49%. Breadth stayed negative but improved: 108 advances, 222 declines and 53 unchanged (A/D 0.49x, from 0.30x). Mutual funds fell 19 to 3.
On the CSE, CSCX fell 0.26% to 8,921.74 and CASPI 0.40% to 14,500.80, against official 26 Oct closes; all five CSE indices were lower. CSE turnover fell 10.34% to Tk 147.26 mn as block value dropped to 5.87% of the total. FINEFOODS (Tk 49.15 mn in 4 trades at Tk 420.00) and SAIHAMTEX (Tk 30.34 mn) took 54.0% of CSE value.
KEY OBSERVATION | The DSEX is still drifting lower, but the selling is narrower and slower than on 26 Oct. The index lost 0.24% against 0.61% the day before, and declines fell from 248 to 222. Regular-board trading picked up rather than drying out. Banks steadied (volume-weighted −0.03%, BRACBANK +0.89% ahead of its 28 Oct board meeting), and Fuel & Power rose 4.21% on SPCL, the day's largest stock by value. Engineering (−1.54%) carried the weakness, with six of the ten largest losers. Momentum continues to fade: the DSEX MACD histogram narrowed from +2.50 to +0.89, close to a bearish crossover. The terminal sentiment gauge rose to 29 'Bear' from 20 'Extreme Bear'.
Table 1: DSE headline statistics
Indicator | 26 Oct 2026 | 27 Oct 2026 | Change | % Change |
|---|---|---|---|---|
DSEX (points) | 5,399.54 | 5,386.54 | -12.99 | -0.24% |
DS30 (points) | 2,090.75 | 2,087.91 | -2.84 | -0.14% |
DSES (points) | 1,053.44 | 1,046.77 | -6.67 | -0.63% |
CDSET (points) | 1,103.50 | 1,101.87 | -1.63 | -0.15% |
Turnover (Tk mn) | 4,105.78 | 4,035.08 | -70.69 | -1.72% |
Volume (shares) | 140,620,082 | 144,125,025 | +3,504,943 | +2.49% |
Transactions | 133,552 | 140,547 | +6,995 | +5.24% |
Securities traded | 384 | 387 | +3 | +0.78% |
Advances / Declines / Unchanged | 74 / 248 / 58 | 108 / 222 / 53 | +34 / −26 / −5 | A/D 0.30x → 0.49x |
Table 2: CSE headline statistics
Indicator | 26 Oct 2026 (official) | 27 Oct 2026 | Change | % Change |
|---|---|---|---|---|
CSCX (points) | 8,945.09 | 8,921.74 | -23.35 | -0.26% |
CASPI (points) | 14,558.65 | 14,500.80 | -57.85 | -0.40% |
CSE30 (points) | 13,575.83 | 13,532.02 | -43.81 | -0.32% |
CSE50 (points) | 1,073.15 | 1,069.60 | -3.55 | -0.33% |
CSI (points) | 784.91 | 778.86 | -6.05 | -0.77% |
Turnover (Tk mn) | 164.24 | 147.26 | -16.98 | -10.34% |
Volume (shares) | 3,295,404 | 2,706,212 | -589,192 | -17.88% |
Transactions | 1,112 | 1,196 | +84 | +7.55% |
Securities traded | 169 | 168 | -1 | -0.59% |
Advances / Declines / Unchanged | 50 / 97 / 22 | 52 / 92 / 24 | +2 / −5 / +2 | A/D 0.52x → 0.57x |
Chart 1.1: DSE turnover, transactions and volume, 26 vs 27 Oct 2026
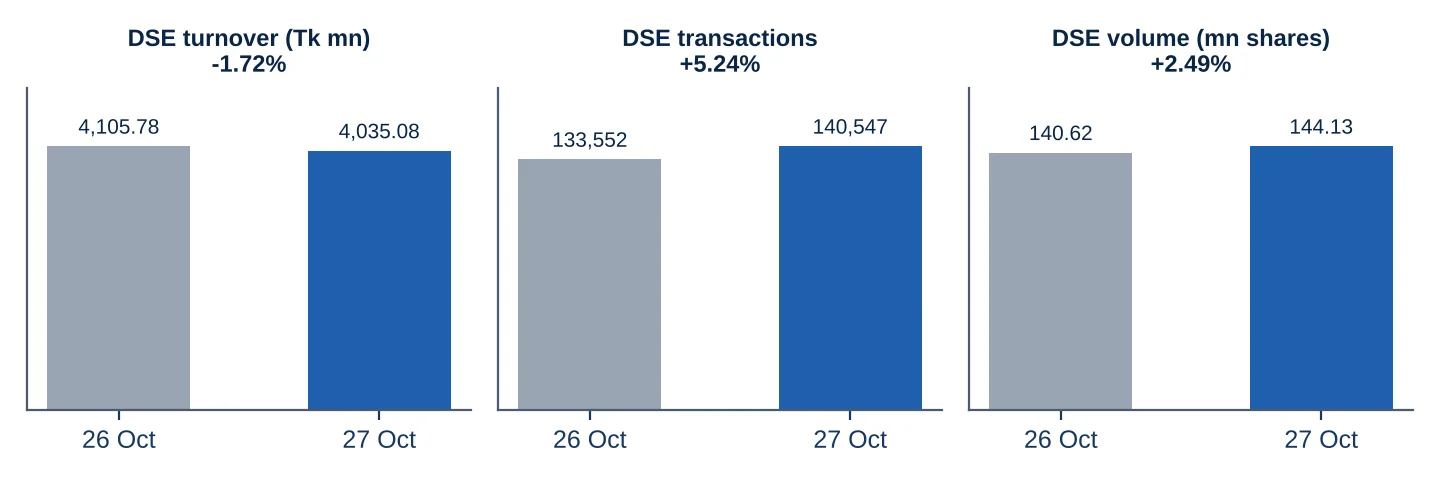
Source: DSE/CSE trade files supplied by Empire Capital; Empire Capital Research calculations. Observation date: 27 Oct 2026.
2. DSE Daily Market Activity
Table 3: DSE market…
Continue reading the full analysis
The remaining research is delivered only after server-side access verification and is not included in this page response.