

DSEX fell 0.19% to 5,422.67 on 18 October, marking a second consecutive decline. Turnover recovered 15.20% to Tk 3,656.12 million, but breadth remained weak at 102 advances versus 216 declines. The index also slipped below its 5-day SMA, indicating that improved activity did not translate into stronger price momentum.

1. Executive Market Summary
The DSEX fell for a second session on Sunday, 18 October 2026, losing 10.51 points (-0.19%) to 5,422.67. DS30 (-0.22%), DSES (-0.35%) and CDSET (-0.20%) also closed lower. The index opened at the 17 Oct close, traded up to 5,456.27 in the opening minutes and then drifted lower, reaching a low of 5,417.43 before closing at 5,422.67. The low held above the 14 Oct low of 5,412.41.
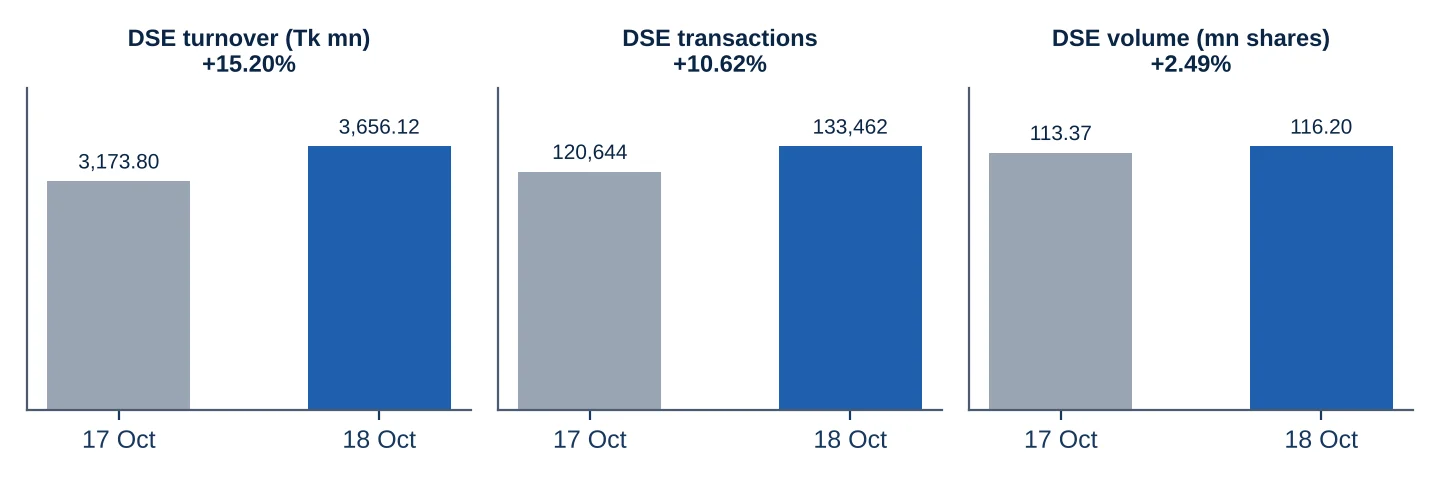
Liquidity recovered part of the previous session's fall. DSE turnover rose +15.20% to Tk 3,656.12 mn, transactions rose +10.62% to 133,462 and volume rose +2.49% to 116,196,006 shares. Turnover remains 13.04% below the prior five-session average (Tk 4,204.28 mn). Breadth stayed negative at 102 advances, 216 declines and 67 unchanged (A/D 0.47x, from 0.42x).
On the CSE, CSCX fell -0.23% to 8,933.67 and CASPI -0.25% to 14,537.10, against official 17 Oct closes (18 Oct levels are provisional terminal readings). CSE turnover was Tk 87.91 mn (+15.99%) across 818 trades. Block trades made up 19.28% of it, and PTL alone made up 34.63%.
KEY OBSERVATION | The day's main finding is that turnover rose while prices fell. DSE value rose 15.2% but declines still outnumbered advances by more than two to one, and the DSEX lost its 5-day SMA (5,429.24). Trading was also concentrated late in the day: the 13:30–14:00 interval alone carried Tk 964.45 mn, or 27.4% of regular-board value. The session was the second-last before the 20–24 October Durga Puja closure, so pre-holiday position adjustment is a plausible influence. It cannot be measured from exchange data.
Table 1: DSE headline statistics
Indicator | 17 Oct 2026 | 18 Oct 2026 | Change | % Change |
|---|---|---|---|---|
DSEX (points) | 5,433.18 | 5,422.67 | -10.51 | -0.19% |
DS30 (points) | 2,090.51 | 2,085.97 | -4.54 | -0.22% |
DSES (points) | 1,072.38 | 1,068.66 | -3.72 | -0.35% |
CDSET (points) | 1,100.97 | 1,098.73 | -2.24 | -0.20% |
Turnover (Tk mn) | 3,173.80 | 3,656.12 | +482.32 | +15.20% |
Volume (shares) | 113,367,818 | 116,196,006 | +2,828,188 | +2.49% |
Transactions | 120,644 | 133,462 | +12,818 | +10.62% |
Securities traded | 386 | 386 | 0 | 0.00% |
Advances / Declines / Unchanged | 96 / 229 / 61 | 102 / 216 / 67 | +6 / −13 / +6 | A/D 0.42x → 0.47x |
Table 2: CSE headline statistics
Indicator | 17 Oct 2026 (official) | 18 Oct 2026 | Change | % Change |
|---|---|---|---|---|
CSCX (points) | 8,954.50 | 8,933.67 | -20.83 | -0.23% |
CASPI (points) | 14,573.25 | 14,537.10 | -36.15 | -0.25% |
CSE30 (points) | 13,497.44 | 13,494.25 | -3.19 | -0.02% |
CSE50 (points) | 1,068.21 | 1,066.49 | -1.72 | -0.16% |
CSI (points) | 793.28 | 792.86 | -0.42 | -0.05% |
Turnover (Tk mn) | 75.79 | 87.91 | +12.12 | +15.99% |
Volume (shares) | 2,225,925 | 2,135,256 | -90,669 | -4.07% |
Transactions | 860 | 818 | -42 | -4.88% |
Securities traded | 134 | 139 | +5 | +3.73% |
Advances / Declines / Unchanged | 60 / 59 / 14 | 42 / 72 / 25 | -18 / +13 / +11 | −30.00% / +22.03% / +78.57% |
Chart 1.1: DSE turnover, transactions and volume, 17 vs 18 Oct 2026
Source: DSE/CSE trade files supplied by Empire Capital; Empire Capital Research calculations. Observation date: 18 Oct 2026.
2. DSE Daily Market Activity
Table 3: DSE market activity
Metric | 17 Oct 2026 | 18 Oct 2026 | % Change |
|---|---|---|---|
DSEX close / intraday high / low | 5,433.18 / 5,472.03 / 5,433.18 | 5,422.67 / 5,456.27 / 5,417.43 | -0.19% |
DSEX intraday range… |
Continue reading the full analysis
The remaining research is delivered only after server-side access verification and is not included in this page response.