
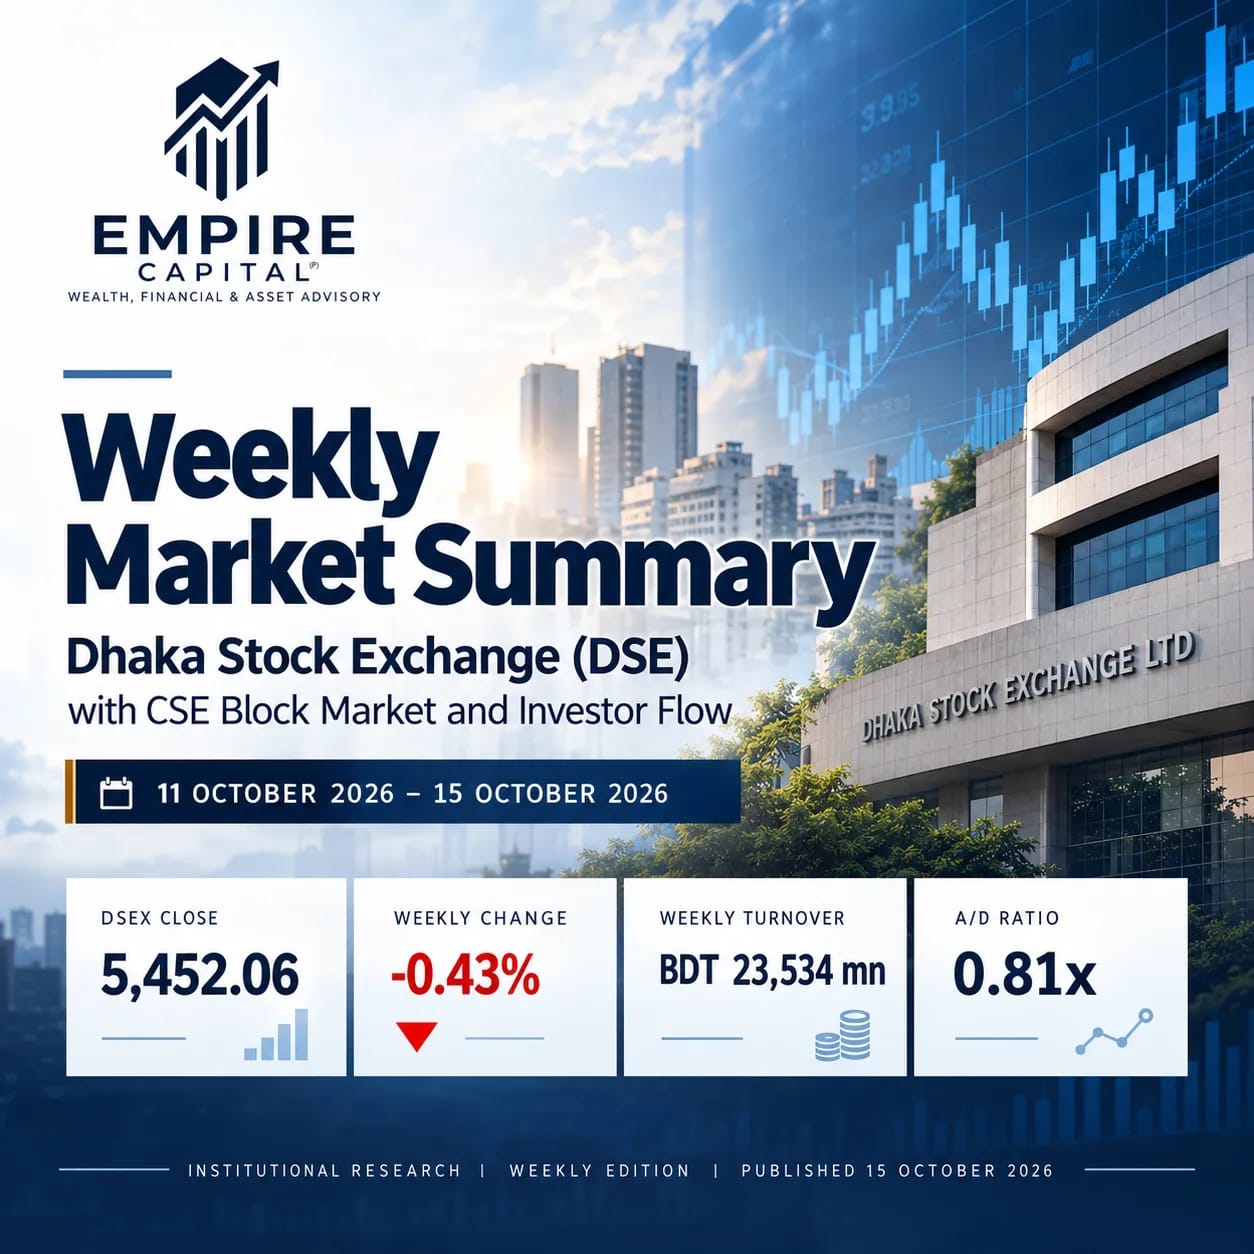
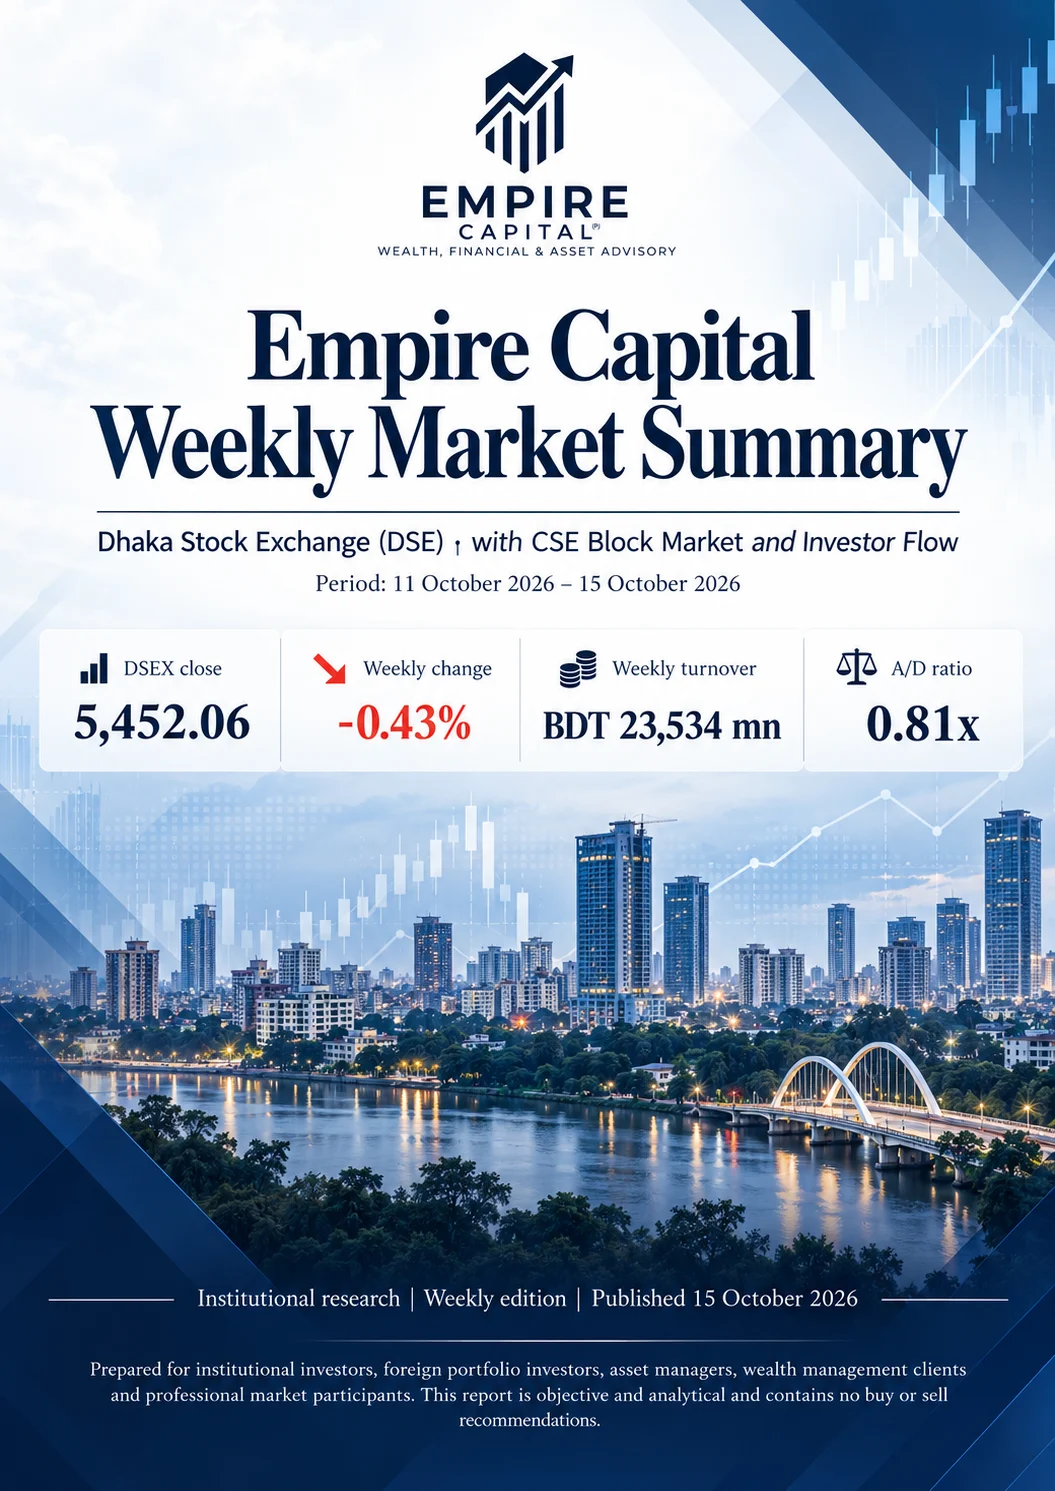
DSEX closed the week at 5,452.06, down 0.43%, marking a third consecutive weekly decline. After falling to 5,404.87 on 12 October, the index recovered across the final three sessions as breadth strengthened sharply, with the A/D ratio reaching 2.67x on 15 October. However, weekly turnover declined 15.42% to BDT 23.53 billion, keeping liquidity subdued despite improving market participation.
1. Executive Weekly Synopsis
Market direction. The DSEX recorded a marginally negative movement for a third consecutive week, closing at 5,452.06 against 5,475.58 at the end of the previous week, a decline of -23.52 points (-0.43%), following declines of 46.68 and 56.07 points in the previous two weeks. The week divided into two phases. The first two sessions extended the sell-off to a closing low of 5,404.87 on 12 October (intraday 5,402.15), under pressure from earnings concerns and gas and power shortages. The last three sessions recovered 47.19 points, supported by broad-based buying, and the index closed the week at its weekly closing high.
Investor sentiment and momentum. Sentiment improved through the week. Breadth was strongly negative on 11 and 12 October (0.30x and 0.16x) and then exceeded 1.2x for three consecutive sessions, reaching 2.67x on 15 October, the strongest reading since 20 September. Momentum remains weak but has stopped deteriorating: the 14-period RSI rose to 37.7 from 34.7, and on Empire Capital's chart reading the DSEX closed above its 200-period weighted moving averages on the weekly and monthly charts on 15 October.
Liquidity and breadth. Liquidity contracted for a third week: main-board turnover totalled BDT 23,533.55 million, -15.4% below the previous week, and turnover on 13 and 14 October (about BDT 4,161 million each) was the lowest in roughly seven months. Weekly breadth improved to neutral (aggregate A/D 0.81x from 0.50x). In the client-type data, retail investors bought more than they sold on average (+1.68 pp of turnover), while foreign investors were net sellers in three of the four sessions in which they were listed (average -2.87 pp).
Weekly Summary Table
Indicator | Start of Week | End of Week | Weekly Change |
|---|---|---|---|
DSEX (points) | 5,475.58 | 5,452.06 | -23.52 (-0.43%) |
DS30 (points) | 2,105.68 | 2,096.51 | -9.17 (-0.44%) |
DSES (points) | 1,086.97 | 1,077.96 | -9.01 (-0.83%) |
Daily turnover (BDT mn), 8 Oct vs 15 Oct session | 5,332.06 | 4,996.90 | -6.29% |
Weekly turnover (BDT mn), prev. week vs this week | 27,823.25 | 23,533.55 | -15.42% |
Market capitalisation (BDT bn) | 6,842.1 | 6,841.1 | -0.01% |
Transactions (trades), 8 Oct vs 15 Oct session | 172,590 | 162,437 | -5.88% |
Transactions (trades), weekly total | 862,000 | 816,398 | −45,602 (−5.29%) |
CSE turnover (BDT mn) / CASPI (8→14 Oct) | 14,660.97 | 722.60 / 14,515.60 | CASPI -0.99% |
2. Weekly Index Performance Analysis
DSEX — Key Weekly Statistics
Measure | Value | Note |
|---|---|---|
Opening level (8 Oct close) | 5,475.58 | Previous week close |
Closing level (15 Oct) | 5,452.06 | Official DSE close; weekly closing high |
Absolute change | -23.52 pts | Net decline from the previous week's close |
Percentage change | -0.43% | Third consecutive weekly decline; smallest of the three |
Weekly high (intraday) | 5,496.94 | Recorded on 11 October |
Weekly low (intraday) | 5,402.15 | Recorded on 12 October |
Volatility range (high − low) | 94.79 pts (1.75%) | Previous week: 118.82 pts (2.19%); range contracted 20.22% |
Closing high & closing low | 5,452.06 & 5,404.87 | Recorded on15 Oct & 12 Oct 2026 |
Weekly range contraction | −24.03 pts (−20.22%) | Indicates a narrower intraday price range than the preceding week |
Recovery from weekly intraday low | +49.91 pts (+0.92%) | 15 October close relative to 12 October intraday low |
Distance from weekly intraday high | −44.88 pts (−0.82%) | 15 October close relative to the weekly intraday high |
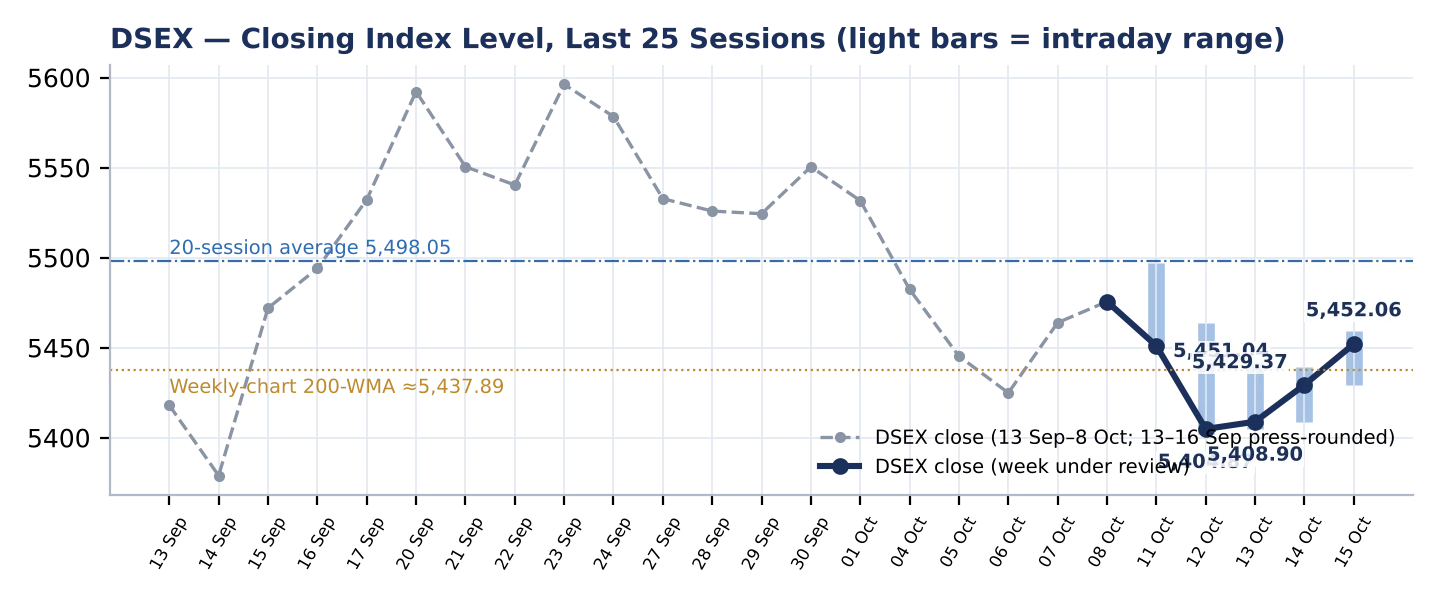
Source: 13–16 Sep closes are press-rounded; 17 Sep onwards are official DSE closes from this and earlier editions. The 200-WMA line is Empire Capital's weekly-chart reading.
Daily Index Levels
Date | DSEX | Chg | DS30 | Chg | DSES | Chg | Intraday high | Intraday low |
|---|---|---|---|---|---|---|---|---|
Sun 11 Oct | 5,451.04 | -24.54 | 2,103.46 | -2.22 | 1,080.31 | -6.66 | 5,496.94 | 5,451.04 |
Mon 12 Oct | 5,404.87 | -46.17 | 2,094.55 | -8.91 | 1,070.68 | -9.63 | 5,463.95 | 5,402.15 |
Tue 13 Oct | 5,408.90 | +4.03 | 2,089.45 | -5.10 | 1,070.14 | -0.54 | 5,441.91 | 5,404.87 |
Wed 14 Oct | 5,429.37 | +20.47 | 2,092.63 | +3.18 | 1,072.44 | +2.30 | 5,439.08 | 5,408.90 |
Thu 15 Oct | 5,452.06 | +22.69 | 2,096.51 | +3.88 | 1,077.96 | +5.52 | 5,459.48 | 5,429.37 |
Source: DSE.
Technical Interpretation
Trend structure: DSEX closed above its 5-session and 10-session moving averages but remained 45.99…
Continue reading the full analysis
The remaining research is delivered only after server-side access verification and is not included in this page response.