

DSEX closed the shortened 17–19 October week at 5,450.63, down only 0.03%, as a strong 19 October rebound offset losses from the first two sessions. DS30 gained 0.33%, but DSES fell 0.70%. Average daily turnover declined 16.03% to BDT 3,952.08 million, while breadth weakened to 0.66x. Foreign investors remained net sellers, and the final-session recovery was concentrated largely in banking stocks.

1. Executive Summary
Comparison basis. This edition compares two trading weeks: Week 1, the five sessions of Sunday 11 to Thursday 15 October 2026, and Week 2, the three sessions of Saturday 17, Sunday 18 and Monday 19 October, which were held ahead of the Durga Puja closure (20–22 October; the market reopens on Sunday 25 October). 16 October was a Friday and not a trading day; 17 October was a special Saturday session. Because the weeks have different numbers of sessions, flow measures (turnover, volume, trades, block value, news items) are compared on a per-session average basis, ratios (A/D, block share, net investor flow) are compared directly, and index and price levels are compared week-end to week-end (8 Oct → 15 Oct for Week 1; 15 Oct → 19 Oct for Week 2).
Market direction. The DSEX closed Week 2 at 5,450.63, effectively unchanged from the Week 1 close of 5,452.06 (−1.43 points, −0.03%). This was a fourth consecutive weekly decline but by far the smallest: the previous three weeks fell 46.68, 56.07 and 23.52 points. Week 1 split into a two-session sell-off to a closing low of 5,404.87 on 12 October and a three-session recovery to its weekly closing high; Week 2 gave back 29.39 points on 17 and 18 October and recovered 27.96 points on 19 October. Leadership changed: in Week 1 the DS30 (−0.44%) and DSES (−0.83%) both fell with the DSEX, while in Week 2 the DS30 rose 0.33% and the DSES fell a further 0.70%, as the 19 October recovery was concentrated in large banks after one-year deposit rates were cut to about 7.5%. Over the two weeks the DSEX is 24.95 points (−0.46%) below its 8 October close.
Intraday rejection on 17 October. Daily chart readings show that 17 October opened at 5,452.06 and traded up to 5,472.21, above the 15 October high and within 3.4 points of the 8 October close (5,475.58), before closing at its session low of 5,433.18. The 5,452–5,476 resistance zone therefore held on the first test of Week 2. Week 2's intraday range (5,417.43–5,472.21, 54.78 points or 1.01%) was much narrower than Week 1's (94.79 points, 1.75%).
Liquidity and breadth. Average daily turnover fell to BDT 3,952.08 million in Week 2 from BDT 4,706.71 million in Week 1 (−16.0%), the fourth consecutive decline in average daily turnover; total turnover was BDT 11,856.24 million against BDT 23,533.55 million over five sessions. Average trades fell 18.4% and volume 18.1%, and 17 October (BDT 3,173.80 million) was the lowest session in more than nine months. Breadth weakened from 0.81x to 0.66x: Week 1 ended with three sessions above 1.4x, but Week 2 had two strongly negative sessions (0.42x, 0.47x) before 1.38x on 19 October. DSE block turnover fell 40.2% per session and its share of turnover to 4.63% from 6.50%.
Investor flows. Retail investors were net buyers in both weeks, slightly more so in Week 2 (average +2.25 percentage points (pp) of turnover against +1.68 pp). Institutions were modest net buyers in both weeks (+0.78 pp against +0.76 pp). Foreign investors remained net sellers (−2.93 pp against −2.87 pp): they recorded no buying at all on 17 and 18 October and their heaviest selling of the two weeks on 19 October (−7.67 pp), exceeding the −6.81 pp of 13 October.
Corporate news flow. The verified DSE news extract records 44 disclosures over the three Week 2 sessions (19 high priority; 14.7 per session) against 16 on 15 October, the last session of Week 1. Week 2 carried seven of the ten FY2026 dividend declarations in the extract (BSCPLC 47.5% cash, MATINSPINN 45% cash plus 10% stock, BEACONPHAR 11% cash), PTL's revaluation surplus, BEACONPHAR's BDT 250 crore oncology plant and the SHARPIND Z-category decision (effective 25 October). Week 1 news was led by BSRM Steels' and BSRM Ltd's record FY26 results (60% and 55% cash dividends), the Beximco board change and the GREENDELT sponsor transfer. Twelve board meetings are scheduled for 25–31 October (Section 11).
MSCI November 2026 Index Review: Potential Impact on Bangladesh's Equity Market
MSCI will resume its regular review of Bangladeshi equities in November 2026, ending special restrictions imposed in February 2023 following the introduction of share-price floors. The upcoming review may result in stock inclusions, exclusions, and adjustments to index weightings, including previously deferred changes to the Number of Shares (NOS) and Foreign Inclusion Factors (FIF).
MSCI will announce the review results on 11 November 2026, with changes effective from 1 December 2026. The re-balancing could influence foreign institutional portfolio allocations, trading liquidity, and short-term price volatility in affected DSE-listed securities.
Investors should closely monitor the final constituent changes and potential foreign fund flows. However, the direction and magnitude of any investment flows remain uncertain, and no final Bangladesh-specific inclusion or exclusion list has yet been announced.
At a Glance: Previous Trade Week (11–15 Oct) vs This Trade Week 2 (17–19 Oct)
Indicator | Week 1 (5 sessions) | Week 2 (3 sessions) | Week-on-week |
|---|---|---|---|
DSEX close (weekly change) | 5,452.06 (−23.52, −0.43%) | 5,450.63 (−1.43, −0.03%) | Decline narrowed to flat |
DS30 close (weekly change) | 2,096.51 (−9.17, −0.44%) | 2,103.40 (+6.89, +0.33%) | Large caps turned positive |
DSES close (weekly change) | 1,077.96 (−9.01, −0.83%) | 1,070.40 (−7.56, −0.70%) | Shariah index lower again |
Total turnover (BDT mn) | 23,533.55 | 11,856.24 | −49.62% |
Average daily turnover (BDT mn) | 4,706.71 | 3,952.08 | −16.03% |
Average daily trades | 163,280 | 133,225 | −18.41% |
Advance / decline (A/D) | 758 / 931 (0.81x) | 385 / 582 (0.66x) | Breadth weaker |
DSE block share of turnover | 6.50% | 4.63% | −1.87 pp |
Retail avg net flow (pp) | +1.68 | +2.25 | +0.57 pp |
Institution avg net flow (pp) | +0.76 | +0.78 | +0.02 pp |
Foreign avg net flow (pp) | −2.87 | −2.93 | Net selling continued |
Market capitalisation (BDT bn) | 6,841.1 | 6,815.9 | −0.37% |
CASPI (CSE) close (weekly change) | 14,576.59 (−84.38, −0.58%) | 14,603.91 (+27.32, +0.19%) | CSE firmer than DSEX |
Source: DSE; CSE; Empire Capital calculations. Week 1 changes are from the 8 Oct close; Week 2 changes are from the 15 Oct close. Week 1 CASPI change uses the 15 Oct CASPI close (14,576.59), published after the 11–15 Oct edition.
2. Week-on-Week Comparison: 11–15 October (Previous) vs 17–19 October (Present)
Method. Week 1 has five sessions and Week 2 three. Totals are shown for reference, but the comparison column uses per-session averages for flow measures; ratios are compared directly and levels (market capitalization, P/E, exchange rate) at each week's final close.
Trading Activity Comparison
Measure | 11 - 15 Oct / close | 11 - 15 Oct avg | 17 -19 Oct / close | 17 -19 Oct avg | Avg W on W |
|---|---|---|---|---|---|
DSE total turnover (BDT mn) | 23,533.55 | 4,706.71 | 11,856.24 | 3,952.08 | −16.03% |
Normal-board turnover (BDT mn) | 21,990.57 | 4,398.11 | 11,299.72 | 3,766.57 | −14.36% |
DSE block turnover (BDT mn) | 1,529.20 | 305.84 | 548.73 | 182.91 | −40.19% |
Block share of turnover | 6.50% | 6.55% | 4.63% | 4.52% | −1.87 pp |
SME turnover (BDT mn) | 100.01 | 20.00 | 80.90 | 26.97 | +34.82% |
ATB turnover (BDT mn) | Not Reported | n/r | 30.38 | 10.13 | n/r |
Volume (mn shares) | 829.24 | 165.85 | 407.27 | 135.76 | −18.14% |
Trades (Total Howla) | 816,398 | 163,280 | 399,674 | 133,225 | −18.41% |
Average value per trade (Tk) | 28,826 | 28,776 | 29,665 | 29,410 | +2.91% |
Issues traded | 1,927 | 385.4 | 1,153 | 384.3 | −0.28% |
Advancing / declining issues | 758 / 931 | 151.6 / 186.2 | 385 / 582 | 128.3 / 194.0 | −15.3% / +4.2% |
A/D ratio | 0.81x | 1.20x | 0.66x | 0.75x | Weaker |
Market capitalisation, week-end (BDT bn) | 6,841.1 | 6,838.98 | 6,815.9 | 6,829.50 | −0.37% |
Market P/E, week-end (x) | 8.71 | 8.69 | 8.66 | 8.64 | −0.05x |
USD/BDT, week-end | 123.50 | 123.38 | 123.72 | 123.60 | +0.18% |
CSE turnover (BDT mn) | 722.61 | 144.52 | 375.43 | 125.14 | −13.41% |
CSE trades | 5,708 | 1,142 | 2,832 | 944 | −17.31% |
CSE block turnover (BDT mn) | 147.20 | 29.44 | 47.51 | 15.84 | −46.21% |
Source: DSE Daily Market Snippets (11–19 Oct); CSE Historical Market Summary; Empire Capital calculations. Week 1 CSE turnover uses the official CSE summary for 15 Oct (BDT 205.43 mn. ATB turnover was not reported in the Week 1 edition.
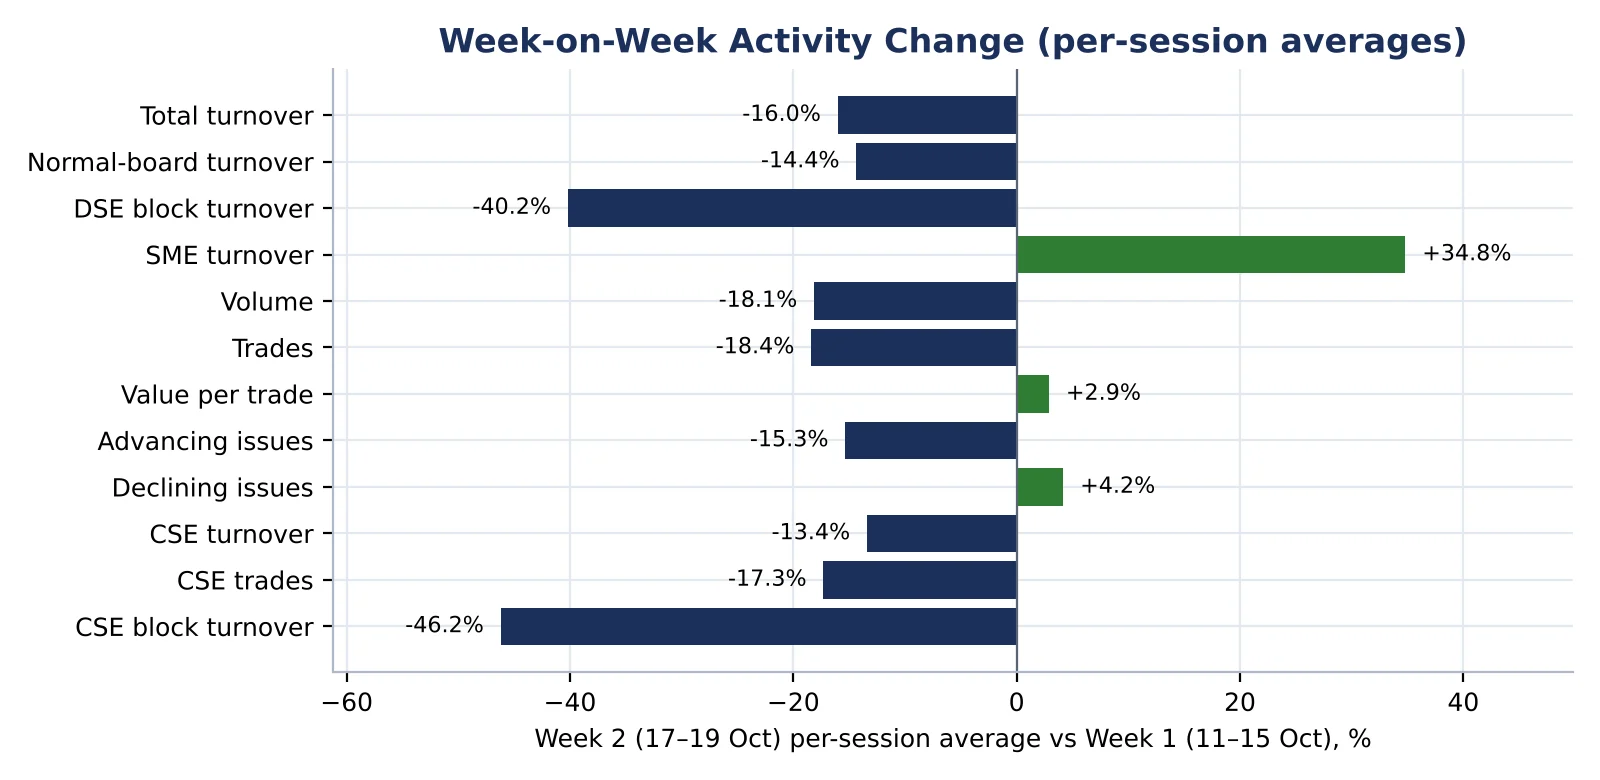
Source: Empire Capital calculations from the table above. Bars show the Week 2 per-session average relative to the Week 1 per-session average.
Two-Week Liquidity Trend
Measure | 11–15 Oct (5 sessions) | 17–19 Oct (3 sessions) | Latest WoW |
|---|---|---|---|
DSEX weekly change (pts) | −23.52 | −1.43 | Decline narrowed |
Total turnover (BDT mn) | 23,533.55 | 11,856.24 | −49.62% |
Average daily turnover (BDT mn) | 4,706.71 | 3,952.08 | −16.03% |
Average daily volume (mn shares) | 165.85 | 135.76 | −18.14% |
Highest / lowest session (BDT mn) | 5,685.97 / 4,161.05 | 5,026.32 / 3,173.80 | −11.60% |
DSE block turnover, avg/session (BDT mn) | 305.84 | 182.91 | −40.19% |
Block share of turnover | 6.50% | 4.63% | −1.87 pp |
Aggregate A/D ratio | 0.81x | 0.66x | Weaker |
Foreign avg net flow (pp) | −2.87 | −2.93 | Net selling |
Source: The 11–15 Oct edition (*block includes the unreconciled 4 Oct block-file value; official 5–8 Oct block total BDT 1,599.81 mn).
What Changed Between the Two Weeks
- Direction. The DSEX moved from a −0.43% week with a strong finish to a flat (−0.03%) week that opened with two declines and closed with a bank-led rise. The 12 October low (5,404.87) was not retested; the Week 2 closing low was 5,422.67…
Continue reading the full analysis
The remaining research is delivered only after server-side access verification and is not included in this page response.