


Dhaka Stock Exchange closed the week under broad pressure, with DSEX falling 2.59% to 5,515.17 as weak market breadth outweighed continued trading activity. Five-session turnover reached BDT 27.71 billion, while liquidity remained highly concentrated and retail participation dominated. With global oil prices and sovereign yields rising into Friday's close, the market enters the coming week near a critical technical pivot around 5,517, with the 5,443–5,445 zone remaining the principal structural support reference.


Dhaka Stock Exchange
Weekly Analysis
6 to 10 September 2026
Global information through Friday 11 September 2026’s week closing
Research and Insights | Empire Capital
A broad correction with concentrated liquidity
DSEX closed at 5,515.17, down 2.59% over the full week. Trading continued, but declines dominated market breadth and liquidity remained concentrated. Friday global developments add energy and funding risks to the outlook for the following DSE week.
This report connects the complete five-session market record with domestic conditions, global markets, sector exposures and conditional technical scenarios. Detailed records, reconciliations and source conventions accompany the analysis.
Published 12 September 2026
DSE reporting period: Sunday 6 September to Thursday 10 September. Global information cutoff: Friday 11 September. All economic releases retain their actual reference periods.
Executive assessment
The week weakened the case for an immediate broad recovery. DSEX lost 146.92 points, with the opening session accounting for 70.54% of the net decline. Aggregate breadth was 0.48 advances per decline. Only one of the five sessions produced a positive DSEX return.
Finding | Measured evidence |
|---|---|
Broad market pressure | DSEX -2.59%; DS30 -2.12%; DSES -2.90% |
Continuing but concentrated liquidity | BDT27.71bn headline turnover; top six sectors 74.12% of Normal Market turnover |
Weak directional participation | 541 advances and 1,130 declines across the five sessions |
Higher external energy costs | Brent +8.65% and WTI +9.37% versus 4 September |
Higher global funding benchmarks | US 10-year +19.10 bp; UK 10-year +21.29 bp over the global week |
The local evidence remains the principal test
The final-session rise in turnover and volume accompanied a lower index. That shows active trading under pressure; the available records do not establish net accumulation. Retail participation averaged 88.05%, and institutions were more represented on the sale side than the buy side on 10 September.
External developments affect the next trading week
Friday US and European equity gains partly recovered earlier losses, while oil remained substantially higher over the week. US monthly CPI accelerated to 0.4%, and the ECB announced a 25-basis-point increase effective 16 September. Those developments reached the information set after DSE closed Thursday.
A recovery requires confirmation
Improving breadth, stronger turnover on advancing sessions and a sustained reclaim of approximately 5,517 would support stabilization. The reported 5,443 to 5,445 chart zone remains a conditional structural reference. The monthly moving-average calculation has not been independently reproduced.
Material qualifications: market components and headline turnover remain unreconciled; weekly security rankings cover only available endpoints; the prior 200-close reconstruction and selected fiscal claims retain their source qualifications. See methodology and Appendices F to I.
Sources: G1 Reuters Friday oil settlements | G26 BLS August CPI release | G35 ECB September policy decision
Contents and coverage
DSE: all five sessions from 6 to 10 September. Global information: through Friday 11 September. Economic releases retain their actual reference periods. Select any entry to navigate to its section.
Main analysis
The opening decline set the weekly direction
Liquidity persisted while valuation multiples eased
Weak breadth limited the rebound
Retail participation dominated trading
Liquidity concentrated in textiles and insurance
Closing liquidity shifted across sectors
Weekly price comparisons require matched endpoints
Recurring liquidity produced different price outcomes
Block activity was concentrated by exchange
Bangladesh macroeconomic position
Friday global markets left a mixed backdrop
Energy costs create several transmission channels
Currency movements affect financing and margins
Global funding benchmarks increased over the week
Growth and inflation evidence needs period discipline
Sector exposure and research priorities
The daily moving average remains a marginal pivot
Scenarios depend on price and participation
Methodology and material limitations
Complete supporting records
Appendix A Complete market observations
Appendix B Complete daily sector records
Appendix C Complete security observations
Appendix D Complete client and category statistics
Appendix E Complete negotiated block records
Appendix F Complete macro observations and interpretation
Appendix G Reconciliations and calculation controls
Appendix H Complete technical evidence
Appendix I Source register and preservation record
Source observations, recalculated measures and conditional interpretations are distinguished in the analysis. G1 to G45 identify global sources. The accompanying archive preserves all available original attachments and complete workbook cell registers.
The week at a glance
Measure | Weekly result | Basis |
|---|---|---|
DSEX | 5,515.17 | -2.59% versus 3 September |
DS30 | 2,095.31 | -2.12% versus 3 September |
DSES | 1,105.06 | -2.90% versus 3 September |
Headline turnover | BDT27.71bn | Five-session sum |
Average turnover | BDT5.54bn | Arithmetic daily average |
Normal Market turnover | BDT26.45bn | Sector-share denominator |
Aggregate breadth | 0.48x | 541 advances / 1,130 declines |
Market capitalization | BDT6,930.68bn | -0.78% versus 3 September |
Market capitalization change | BDT-54.30bn | Reference BDT6,984.98bn |
Market P/E | 8.78x | 8.97x reference; -0.19x |
Average retail share | 88.05% | Five daily published shares |
Daily WMA snapshot | 5,516.76 | Approximately 5,517 |
Structural chart zone | 5,443 to 5,445 | Conditional weekly and monthly readings |
Two dates frame the assessment
The DSE result is measured through Thursday 10 September. Global markets are updated through Friday 11 September. Combining these cutoffs provides a useful opening backdrop for the next week, while preserving the time sequence of information.
The displayed daily WMA is rounded to approximately 5,517 for decision use. Full source precision is preserved in Appendices A and H. The reported structural chart zone is conditional; its monthly component is not a verified 200-month reconstruction.
Source: consolidated five-session workbook data and supplied technical chart readings. Executive metrics use stated denominators and period
The opening decline set the weekly direction
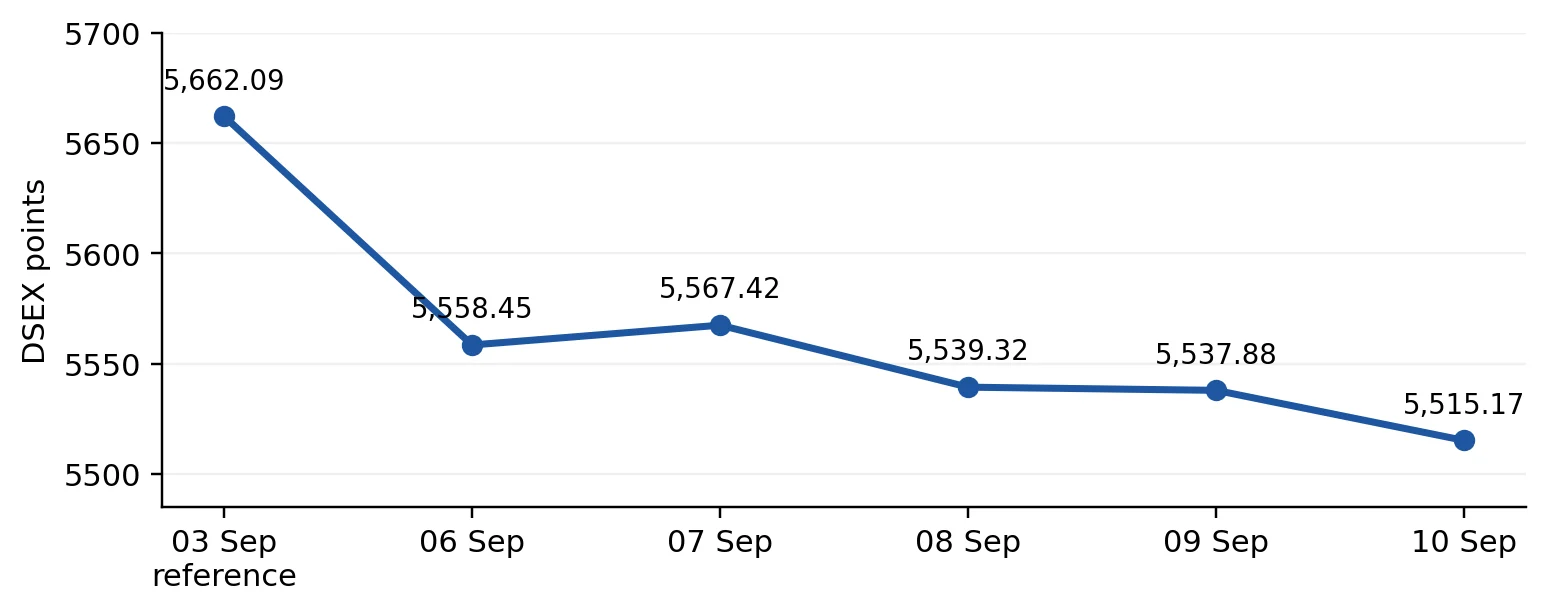
Full-week DSEX path. The 3 September close provides the reference for the five-session week.
Index | 03 Sep reference | 10 Sep close | Point change | Full week return |
|---|---|---|---|---|
DSEX | 5,662.09 | 5,515.17 | -146.92 | -2.59% |
DS30 | 2,140.73 | 2,… |
Continue reading the full analysis
The remaining research is delivered only after server-side access verification and is not included in this page response.