

September marked a transition month for Bangladesh equities as the DSEX found support following the August energy shock but stopped short of establishing a sustained uptrend. DSEX declined 0.85% to 5,550.44, while second-half liquidity improved amid easing energy stress. Weak market breadth, institutional selling, elevated global yields and the approaching earnings season remained key constraints. EC_Sept_month

1. Executive Summary
September was a transition month: the DSE found a floor, but not yet a trend. It opened under the weight of August's energy crisis, absorbed a second shock from global rates when the US Federal Reserve raised its policy rate on 16 September, and closed with liquidity rebuilding as Middle East energy flows began to recover. The DSEX fell 0.85% to 5,550.44, after a 5.00% draw down to 5,379.00 on 14 September and a 3.19% recovery; it remains 14.08% higher year-to-date.
Four layers explain the month. Domestically, load-shedding above 3,500 MW in August and spot LNG at more than double pre-war prices put energy-intensive earnings at risk, and a Tk20-per-litre fuel increase followed on 21 September. Globally, US 10-year yields near 5%, the highest since 2007, raised the hurdle for frontier-market equities. In the market, turnover rose 19.84% between the two halves of the month but breadth did not follow (A/D 0.80), and leadership narrowed to insurers and closed-end funds. For Empire Capital, the month's evidence points to conditions migrating from our Scenario 2 toward Scenario 1, conditional on energy de-escalation holding through the October earnings season.
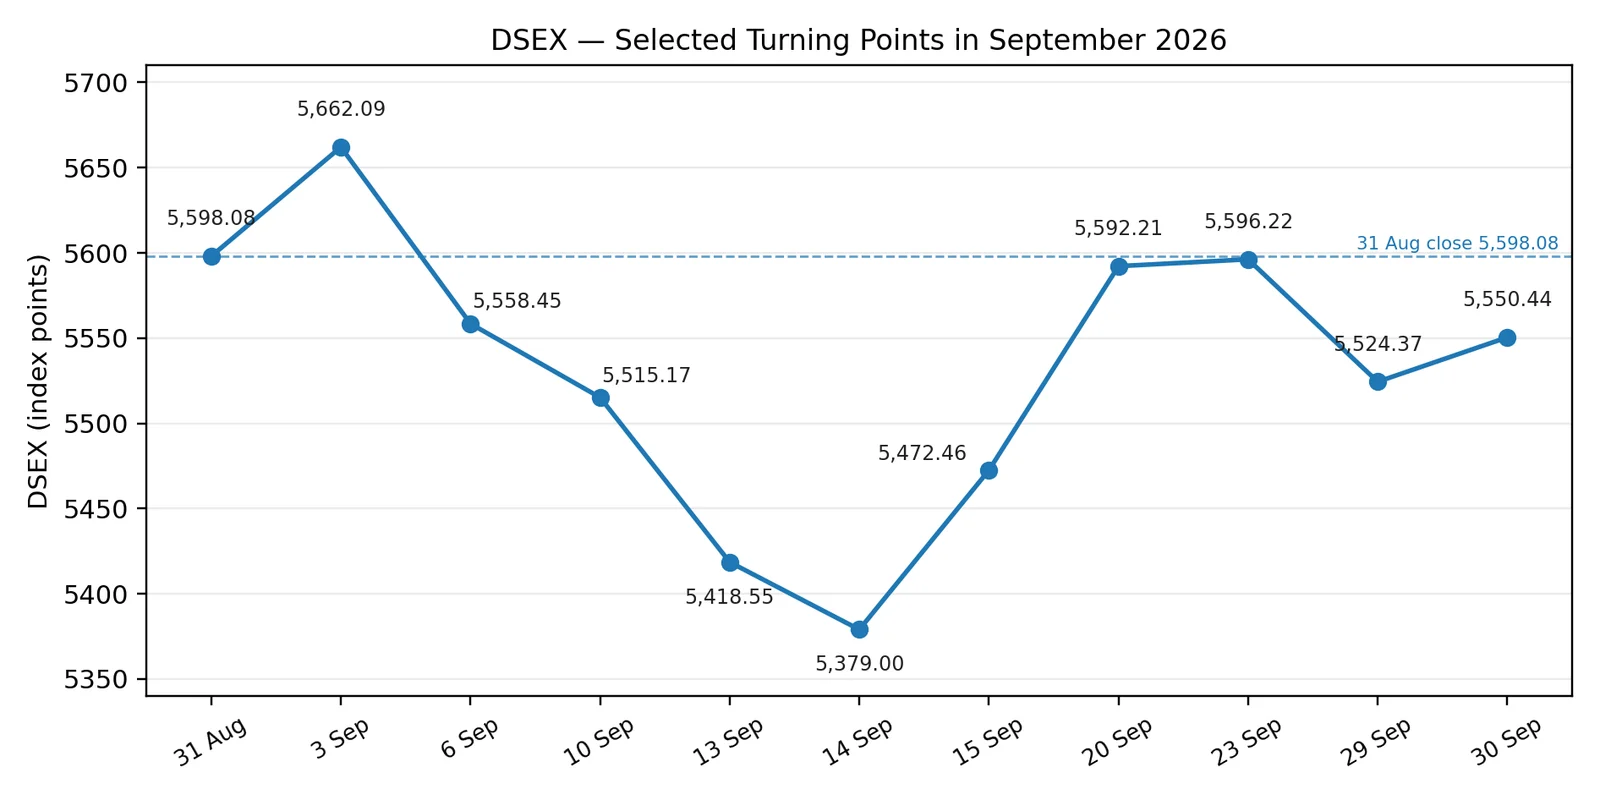
Figure 1. DSEX selected turning points (closing levels). Source: DSE
2. September at a Glance
Metric | August 2026 | September 2026 | Change | Assessment |
|---|---|---|---|---|
DSEX (close) | 5,598.08 | 5,550.44 | -0.85% | Loss narrowed from -5.05% |
DSEX year-to-date | +15.06% | +14.08% | -0.98 pp | Gains largely intact |
DS30 (close) | 2,113.24 | 2,108.45 | -0.23% | Large caps most resilient |
DSES (close) | 1,124.49 | 1,102.49 | -1.96% | Weakest index again |
Average daily turnover | Tk876cr | Tk651.39cr | -25.64% | Lower average, rising trend |
Month-end daily turnover | Tk477cr | Tk699.12cr | +46.49% | Rebuilt from trough |
Total turnover (22 sessions) | Tk. 17,525.88cr | Tk14,330.54cr | -18.23% | Block share 5.10% |
Trades per session (avg) | 149,199 (31 Aug) | 181,943 | +21.95% | More activity per day |
Volume per session (avg) | 177.52mn (31 Aug) | 226.54mn | +27.61% | Higher share turnover |
Market capitalisation | Tk694,739cr | Tk687,477cr | -1.05% | Verified month-end |
Advance/decline (month) | 2,538 / 4,316 (0.59x) | 3,177 / 3,981 (0.80) | +0.21x | Breadth negative |
Market P/E | 8.89x | 8.82x | -0.07x | Valuation undemanding |
.
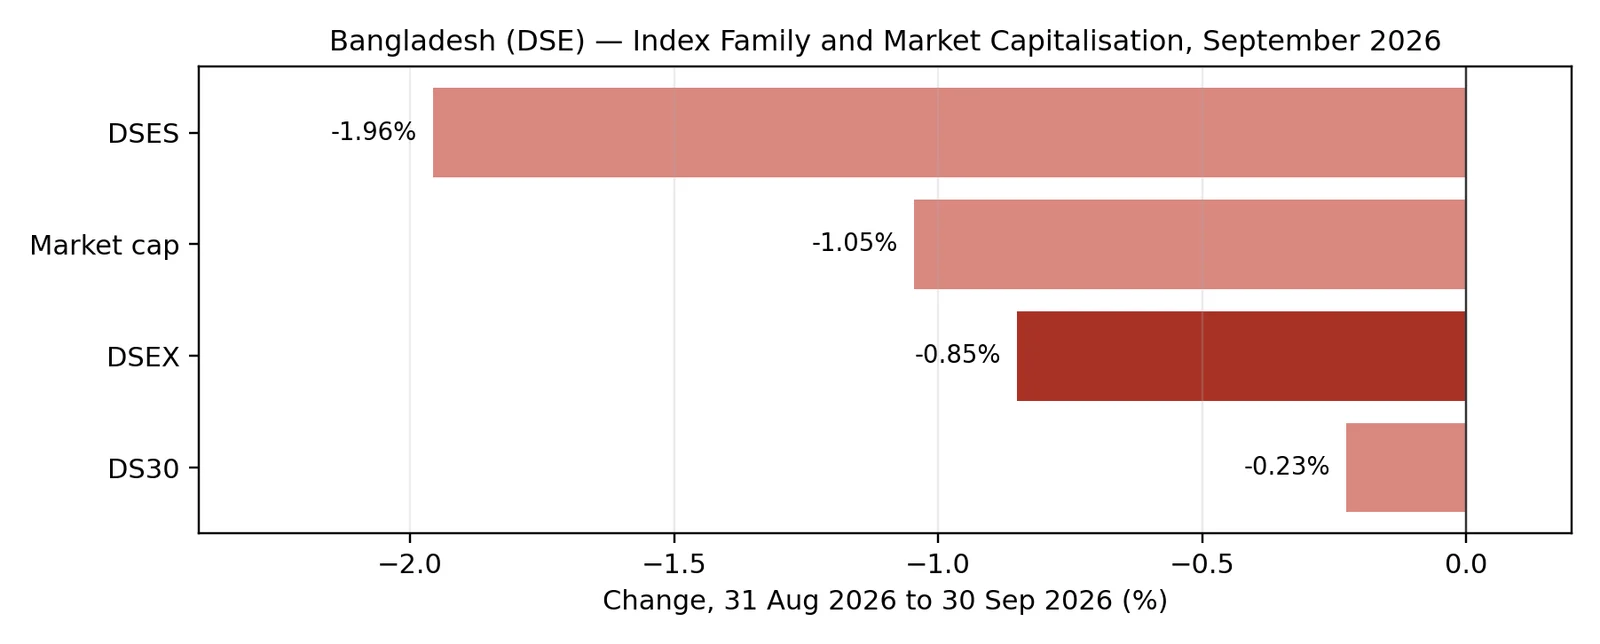
Figure 2. DSE index family and market capitalization, change 31 Aug–30 Sep 2026. Source: official DSE snippets.
3. August–September Power and Energy Transition
August was the acute phase. A 21 July fire at Excelerate Energy's floating LNG terminal (FSRU) at Moheshkhali removed about 450 mmcfd of gas, and Qatar's reduced deliveries during the Iran conflict tightened supply further. Reported load-shedding reached 3,512 MW on 2 August and 3,692 MW at the end of the month, when the average was about 2,509 MW and Dhaka experienced three to six outages a day. On 19 August, generation of 14,815 MW against demand of 17,345 MW left a 2,530 MW shortfall. Industrial clusters bore much of the cost: knitwear makers reported gas pressure falling to zero at some locations, and BKMEA warned that August production losses would show up in September exports.
September brought partial relief, not normalization. The power state minister told parliament on 2 September that conditions would improve within 15 days. Load-shedding at the 5 September evening peak was 2,258 MW against 17,017 MW of demand, still high but below August's peaks, and new LNG cargoes were scheduled for 13–14 and 23–24 September. The cost of that relief is high: the September cargoes were approved at $24.25–24.625 per MMBtu, more than double the $10–12 pre-war spot range, or roughly Tk1,000 crore per cargo against Tk410–490 crore before the war.
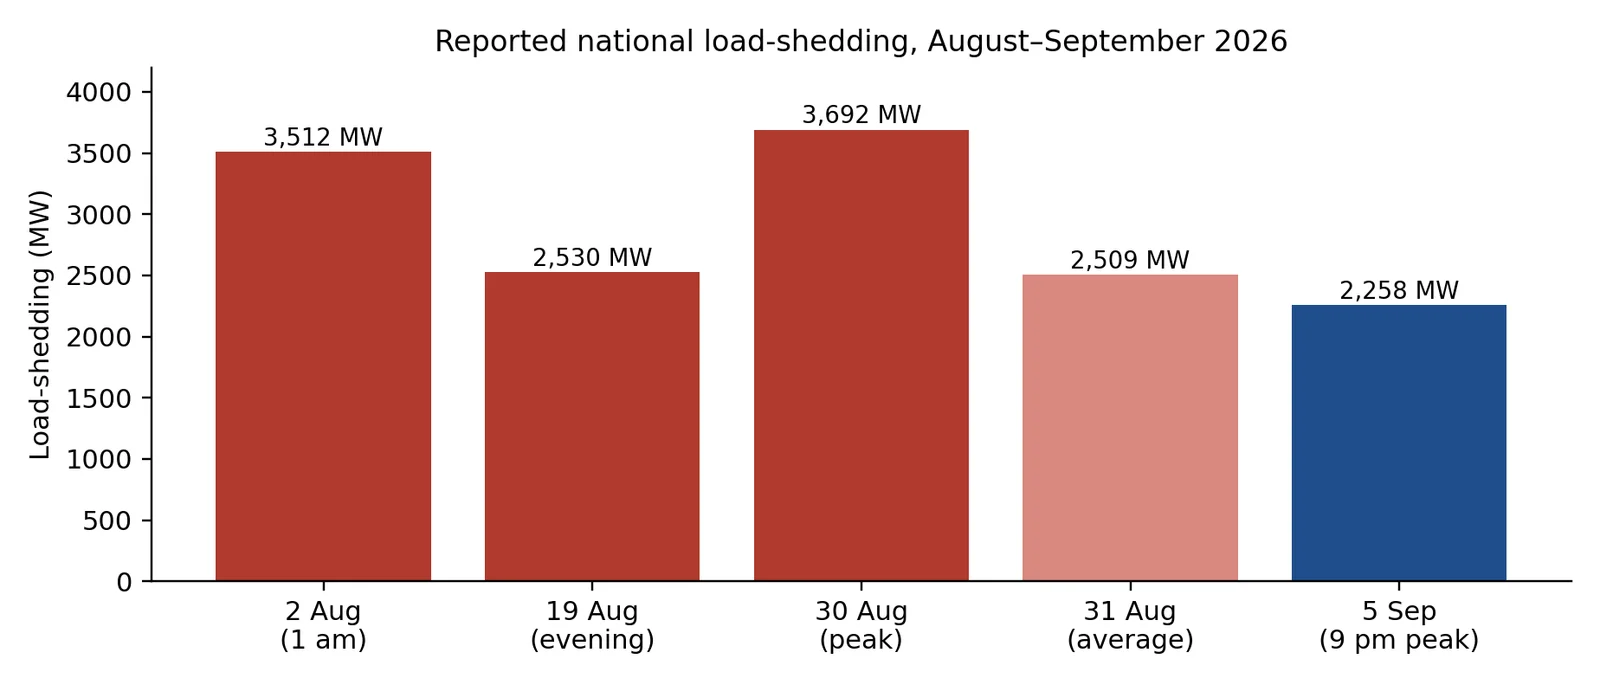
Figure 3. Reported national load-shedding at selected points. Sources: Observer, Financial Express, Ittefaq, Power Grid Bangladesh via Jago News.
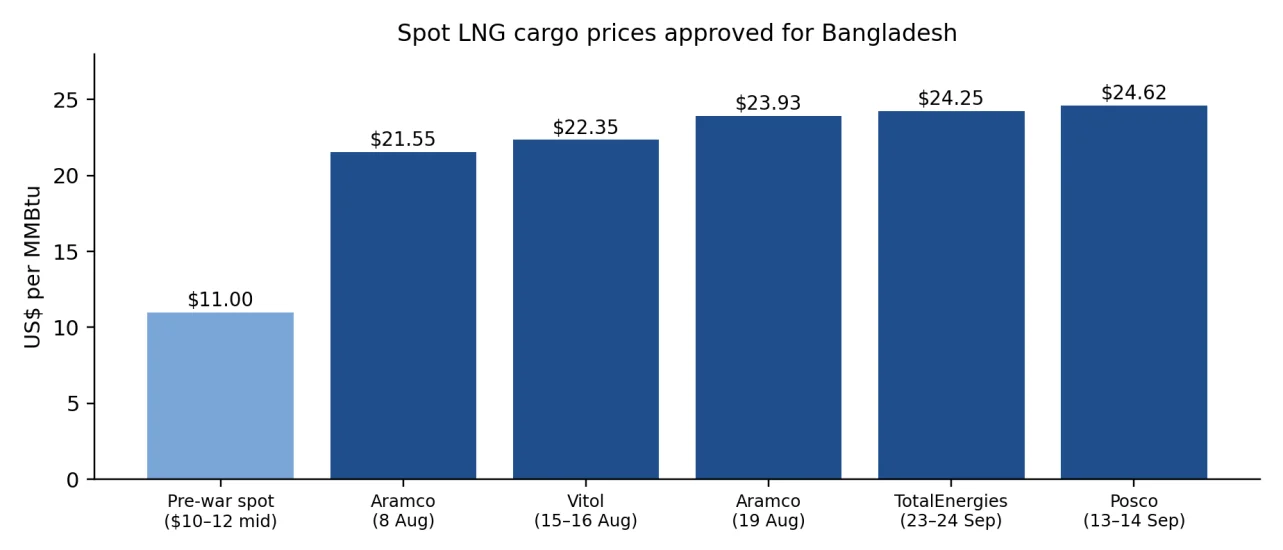
Figure 4. Spot LNG cargo prices approved for Bangladesh (US$/MMBtu). Pre-war bar is the mid-point of the reported $10–12 range. Sources: Financial Express, The Daily Star, Asia News Network.
Equity transmission. Energy is the single variable that connects all four layers of this report: it determines capacity utilization and therefore EPS for textiles, ceramics and cement; it feeds the import bill and FX demand; it drives administered fuel prices and inflation; and through all of these it shapes the policy-rate path and investor…
Continue reading the full analysis
The remaining research is delivered only after server-side access verification and is not included in this page response.