
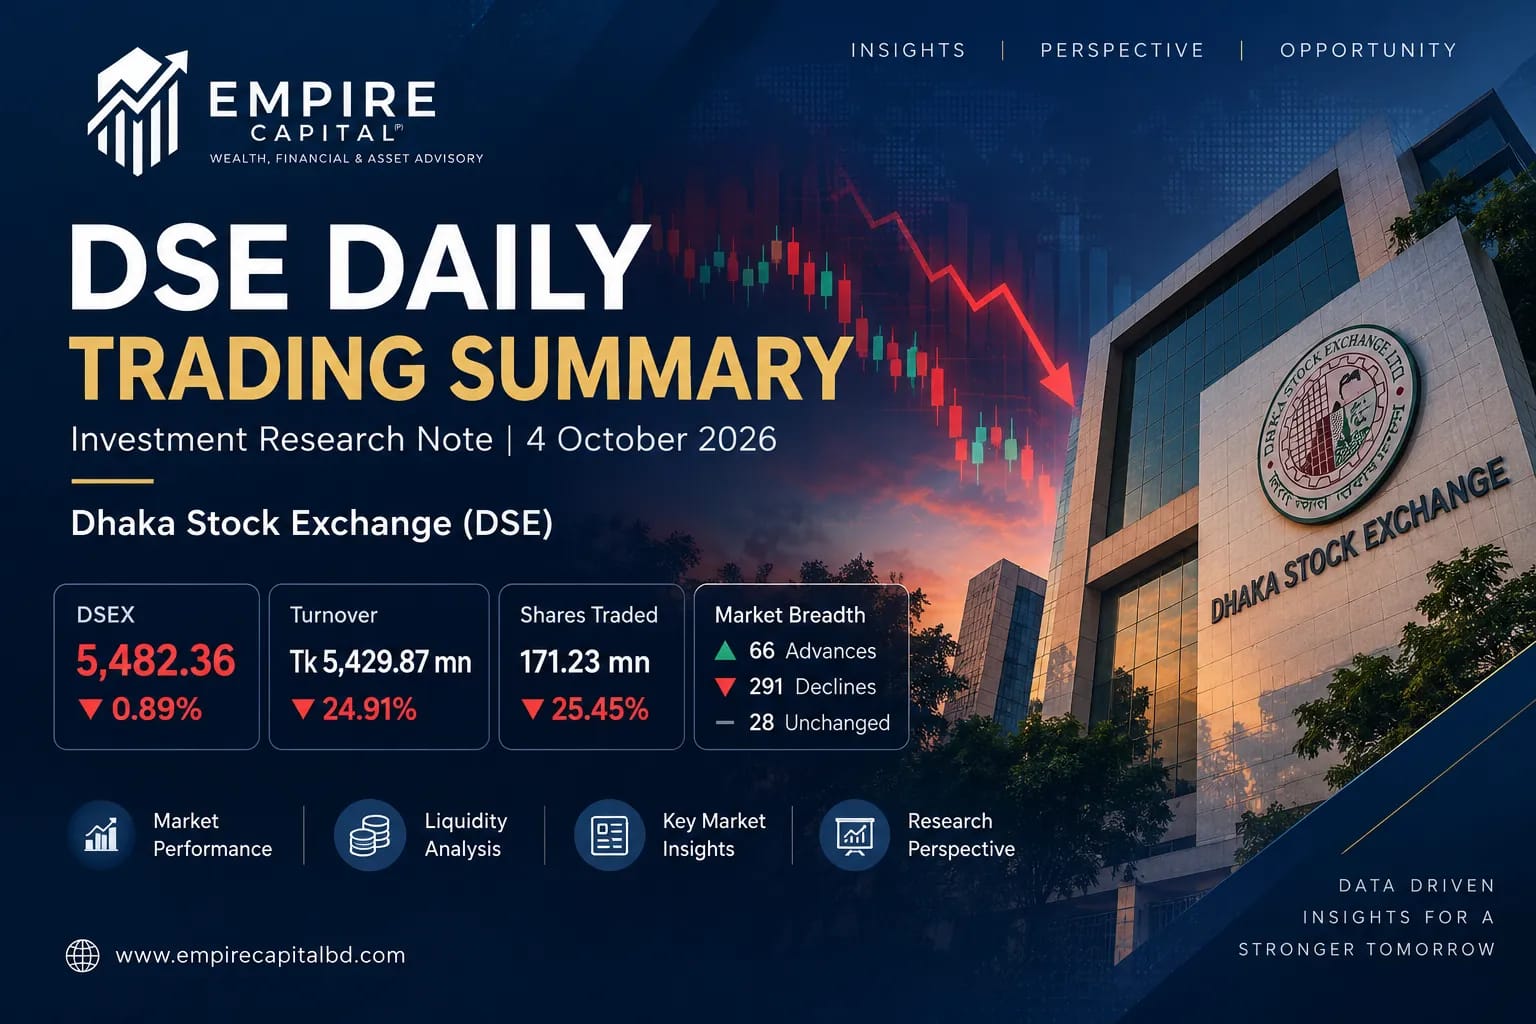
The DSE extended its correction on 4 October 2026, with the DSEX declining 0.89% to 5,482.36 amid sharply weaker market breadth and contracting liquidity. Turnover fell 24.91% to Tk5,429.87 million, while shares traded declined 25.45% to 171.23 million. Market breadth deteriorated to 66 advances against 291 declines, with the A/D ratio falling to 0.23x. The session points to continued weakness in participation and risk appetite, with the sustainability of liquidity and the 5,472–5,494 support zone becoming key areas to monitor.

1. Executive Summary
The Dhaka Stock Exchange (DSE) fell for a second session on Sunday, 4 October 2026. DSEX lost 0.89% to 5,482.36, closing at its session low and below the 5,524–5,533 support cluster that had held since 27 September. The close is the lowest since 15 September. Breadth was the weakest of the period (66 advances / 291 declines), and turnover fell 24.91% to the lowest level in the period. The DSE sentiment gauge read 19 ("Extreme Bear"), also the period low. The Chittagong Stock Exchange (CSE) fell in step: CSCX –1.06% and CASPI –1.15% (official CSE closes). For the first time in this series, the supplied CSE Historical Market Summary provides official CSE index levels, trades, volume and turnover for every session reviewed, and these match the tick data exactly. DSE figures are official and reconciled.
1.1 DSE Headline Statistics (official)
Indicator | 4 Oct 2026 | 1 Oct 2026 | Change |
|---|---|---|---|
DSEX closing level | 5,482.36 | 5,531.65 | –49.29 pts |
DSEX daily point change | –49.29 | –18.79 | —30.50 pts |
DSEX daily % change | –0.89% | –0.34% | —0.55 pp |
Total turnover (Tk mn) | 5,429.87 | 7,231.11 | –24.91% |
Total transactions (howla) | 171,907 | 184,783 | –6.97% |
Total shares traded (mn) | 171.23 | 229.69 | –25.45% |
Total traded scrips | 385 | 385 | 0 |
Advances | 66 | 85 | –19 |
Declines | 291 | 242 | +49 |
Unchanged | 28 | 58 | –30 |
1.2 CSE Headline Statistics (official, CSE Historical Market Summary)
Indicator | 4 Oct 2026 | 1 Oct 2026 | Change |
|---|---|---|---|
CSCX closing level | 9,004.63 | 9,100.89 | –96.26 / –1.06% |
CASPI closing level | 14,660.77 | 14,831.98 | –171.21 / –1.15% |
CSE30 / CSE50 | 13,437.78 / 1,060.78 | 13,645.58 / 1,075.64 | –1.52% / –1.38% |
Total turnover (Tk mn) | 133.26 | 157.76 | –15.53% |
Total transactions | 959 | 1,175 | –18.38% |
Total shares traded (mn) | 5.30 | 8.02 | –33.89% |
Total traded scrips (tick) | 171 | 188 | -17 / -9.04% |
Advances / Declines / Unchanged | 40 / 114 / 17 | 71 / 84 / 33 | -31 / +30 / -16 |
1.3 Cross-Market Conclusion
Direction. DSEX fell 49.29 points (–0.89%) to 5,482.36, its second consecutive close at the session low, after an early high of 5,540.50. The close broke below the 29 September pullback low (5,524.37), a new lower low after the 1 October lower high, and is the lowest close since 15 September. DS30 (–0.87%) and DSES (–0.96%) fell by similar amounts, so the decline was not limited to small caps. The CSE fell more on its broad indices: CSCX –1.06%, CASPI –1.15% and CSE30 –1.52%. Sentiment gauges read 19 ("Extreme Bear") for the DSE and 23 ("Bear") for the CSE.
Liquidity and intensity. DSE turnover fell –24.91% to Tk 5,429.87 mn, volume –25.45% and transactions –6.97%, all period lows. Normal-board turnover fell 22.65% and block turnover halved (–49.61%). CSE turnover fell –15.53% to Tk 133.26 mn on 959 trades, the fewest in the official series shown (back to April 2026). The decline therefore came on shrinking participation: selling was not heavy, but buying interest was thin.
Breadth and participation. DSE breadth was 66 advances / 291 declines (A/D 0.23), the weakest reading in the period. That is 4.41 decliners per advancer, above the 2.5–3.0 warning band in the October risk framework and the second consecutive session above 2.5 (Section 25). Investor flow changed direction. Retail turned net seller (–0.54%) for the first time since 24 September, while institutions turned net buyers (+0.63%). Foreign investors were net sellers (–0.98%) with zero recorded buying. Retail's share of activity rose to 92.00%, the highest in the period.
Relative activity and concentration. The DSE accounted for 97.60% of combined turnover. Textile remained the largest DSE sector at 28.14%, but leadership was more dispersed: the top ten counters took 24.80% of normal-board turnover, against 34.07% on 1 October. CSE block trades were 53.54% of CSE turnover. Overall, the session confirmed the 1 October rejection with a lower low on falling liquidity and extreme breadth weakness. The 14 September correction low (5,379; CSCX 8,908.96) is now the main structural reference.
2. DSE Market Activity Snapshot
Indicator | Value |
|---|---|
Traded scrips | 385 |
Transactions (howla) | 171,907 |
Shares traded | 171,228,888 |
Turnover (Tk mn) | 5,429.87 |
of which normal / main board incl. debt (Tk mn) | 5,125.37 |
of which block (Tk mn) | 304.29 |
of which yield-based debt (Tk mn) | 0.21 |
SME board turnover, separate (Tk mn) | 37.07 |
ATB turnover, separate (Tk mn) | 0.00 |
Average turnover per transaction (Tk) | 31,586 |
Average shares per transaction | 996.06 |
Average turnover per traded scrip (Tk mn) | 14.10 |
Average transactions per scrip | 446.51 |
Traded value per share (Tk) | 31.71 |
Total market capitalisation (Tk mn) | 6,781,780 |
Market P/E (x) | 8.73 |
Calculation: Tk 5,429.87 mn ÷ 171,907 transactions = Tk 31,586 per transaction; 171,228,888 shares ÷ 171,907 = 996.06 shares per transaction; Tk 5,429.87 mn ÷ 385 scrips = Tk 14.10 mn per scrip.
3. CSE Market Activity Snapshot
Indicator | Value |
|---|---|
Traded scrips | 171 |
Transactions | 959 |
Shares traded | 5,303,651 |
Turnover (Tk mn) | 133.26 |
of which main board (Tk mn) | 61.91 |
of which block (Tk mn) | 71.35 |
Average turnover per transaction (Tk) | 138,962 |
main board only (Tk) | 65,934 |
Average shares per transaction | 5,530.40 |
Average turnover per traded scrip (Tk mn) | 0.779 |
Average transactions per… |
Continue reading the full analysis
The remaining research is delivered only after server-side access verification and is not included in this page response.