
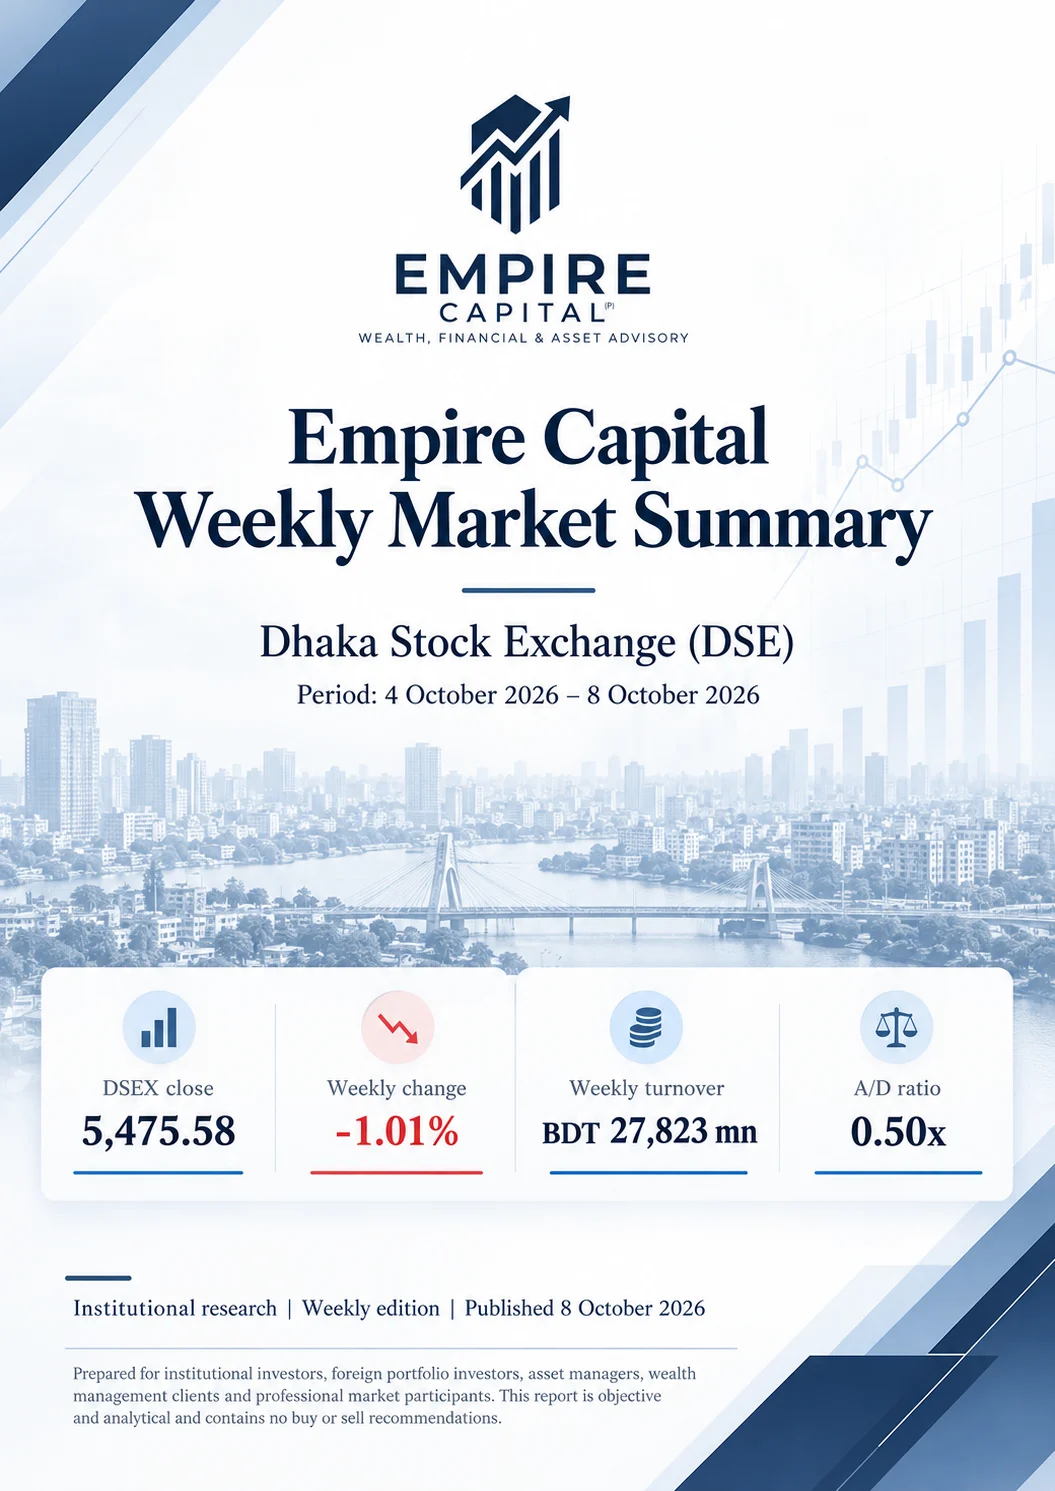
Bangladesh’s stock market experienced a challenging week from 4–8 October 2026, with the DSEX declining 1.01% to close at 5,475.58 points. Dhaka Stock Exchange turnover fell 21.19% week-on-week, reflecting weaker trading activity despite a rebound in the final two sessions. Empire Capital Research examines market breadth, sector turnover, foreign and institutional trading estimates, and key technical levels to assess whether the recovery signals stabilization or continued market uncertainty.
1. Executive Weekly Synopsis
Market direction. DSEX closed at 5,475.58, down 56.07 points (1.01%) from the 1 October close of 5,531.65. The index declined on 4–6 October to 5,424.91, then advanced for two successive sessions; the 7–8 October rebound totalled 50.67 points (+0.93% from the 6 October close). The week nonetheless ended below the earlier 5,524 support level.
Liquidity and participation. Official DSE main-market turnover declined 21.19% to Tk 27,823.25 million from Tk 35,306.25 million, while share volume fell 20.35% to 901.47 million. All five sessions recorded 862,000 DSE howla transactions. Top-ten symbols accounted for 27.28% of market turnover on a tick-derived transaction-value basis (not the 24.64% closing-price proxy in the earlier draft).
Breadth and investor positioning. The cumulative daily count comprised 561 advancing versus 1,129 declining issues (A/D 0.50x). Breadth improved on 7 and 8 October, but estimated foreign net selling for the five sessions was Tk 146.17 million on the DSE normal-market turnover basis; institutions were estimated net sellers of Tk 34.30 million. These are DSE client-type-percentage estimates, not independently published clearing flows.
Cross-exchange interpretation. CSE CASPI lost -1.15% and CSCX lost -0.92% on the same Thursday-to-Thursday basis. CSE traded Tk 753.40 million during 4–8 October; Tk 377.08 million (50.05%) came from reported block trades, versus 6.84% on DSE. This is a liquidity-structure contrast rather than a conclusion about participant identities.
Weekly Summary Table
Indicator | 1 Oct baseline / prior week | 8 Oct / this week | Change |
|---|---|---|---|
DSEX | 5,531.65 | 5,475.58 | −56.07 (−1.01%) |
DS30 | 2,103.55 | 2,105.68 | +2.13 (+0.10%) |
DSES | 1,100.26 | 1,086.97 | −13.29 (−1.21%) |
Weekly DSE turnover (Tk mn) | 35,306.25 | 27,823.25 | −21.19% |
Weekly DSE volume (mn) | 1,131.85 | 901.47 | −20.35% |
Weekly howla transactions | 933,538 | 862,000 | −7.66% |
DSE weekly block trades (Tk mn) | 2,438.66 | 1,904.10 | −21.92% |
CSE weekly turnover (Tk mn) | 1382.24 | 753.40 | -45.49% |
Source / method: Official DSE daily snippets dated 1 and 4–8 October; CSE Historical Market Summary dated 8 October; tick and block transaction workbooks. Weekly changes use 1 October closes as baseline.
2. Weekly Index Performance Analysis
DSEX — Key Weekly Statistics
Measure | Value |
|---|---|
Prior-week close | 5,531.65 |
Week-end close | 5,475.58 |
Weekly return | −56.07 points (−1.01%) |
Weekly intraday high | 5,540.50 |
Weekly intraday low | 5,421.68 |
Range | 118.82 points (2.19% of low) |
Highest / lowest closing | 5,482.36 / 5,424.91 |
5-session SMA | 5,458.40 |
10-session SMA | 5,495.71 |
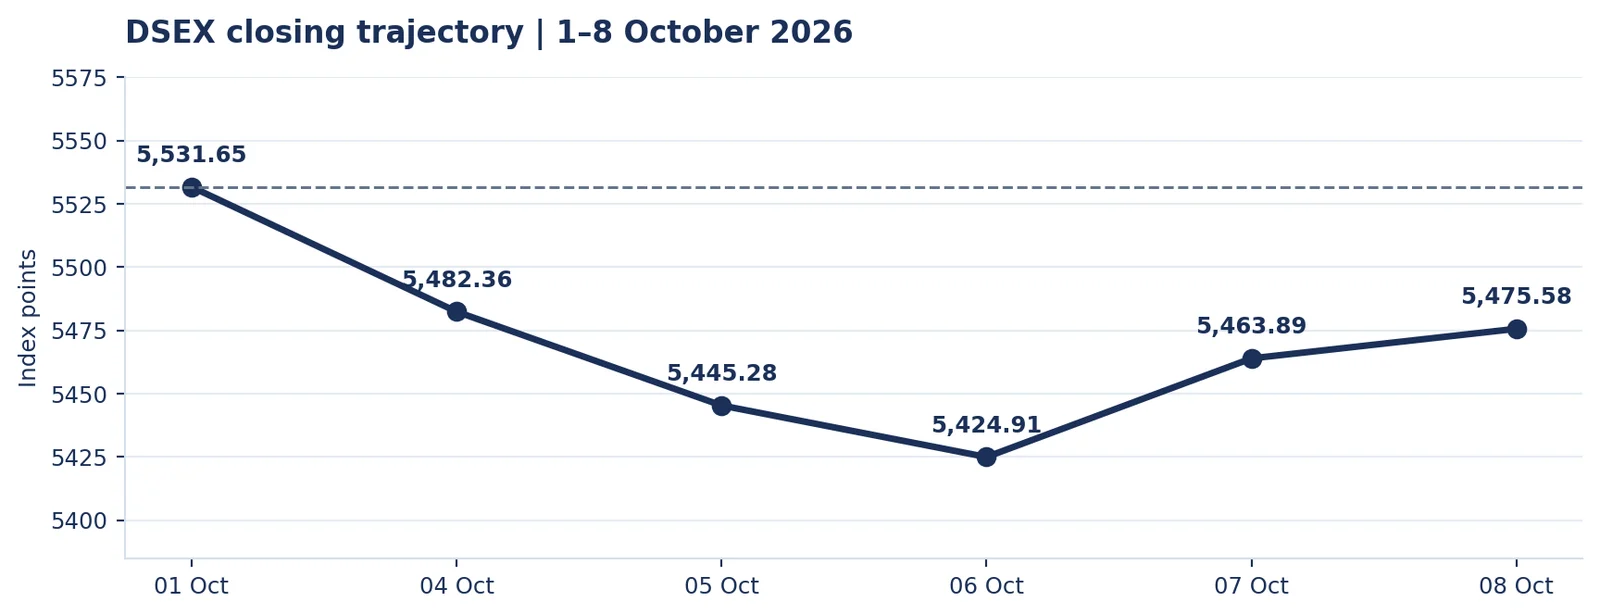
Figure 1. Closing DSEX levels show the three-session decline and a two-session rebound.
Daily DSE Index Levels
Date | DSEX | Δ DSEX | DS30 | Δ DS30 | DSES | Δ DSES |
|---|---|---|---|---|---|---|
04 Oct | 5,482.36 | -49.29 | 2,085.29 | -18.26 | 1,089.68 | -10.58 |
05 Oct | 5,445.28 | -37.08 | 2,081.75 | -3.54 | 1,079.80 | -9.88 |
06 Oct | 5,424.91 | -20.37 | 2,077.09 | -4.66 | 1,074.85 | -4.… |
Continue reading the full analysis
The remaining research is delivered only after server-side access verification and is not included in this page response.